
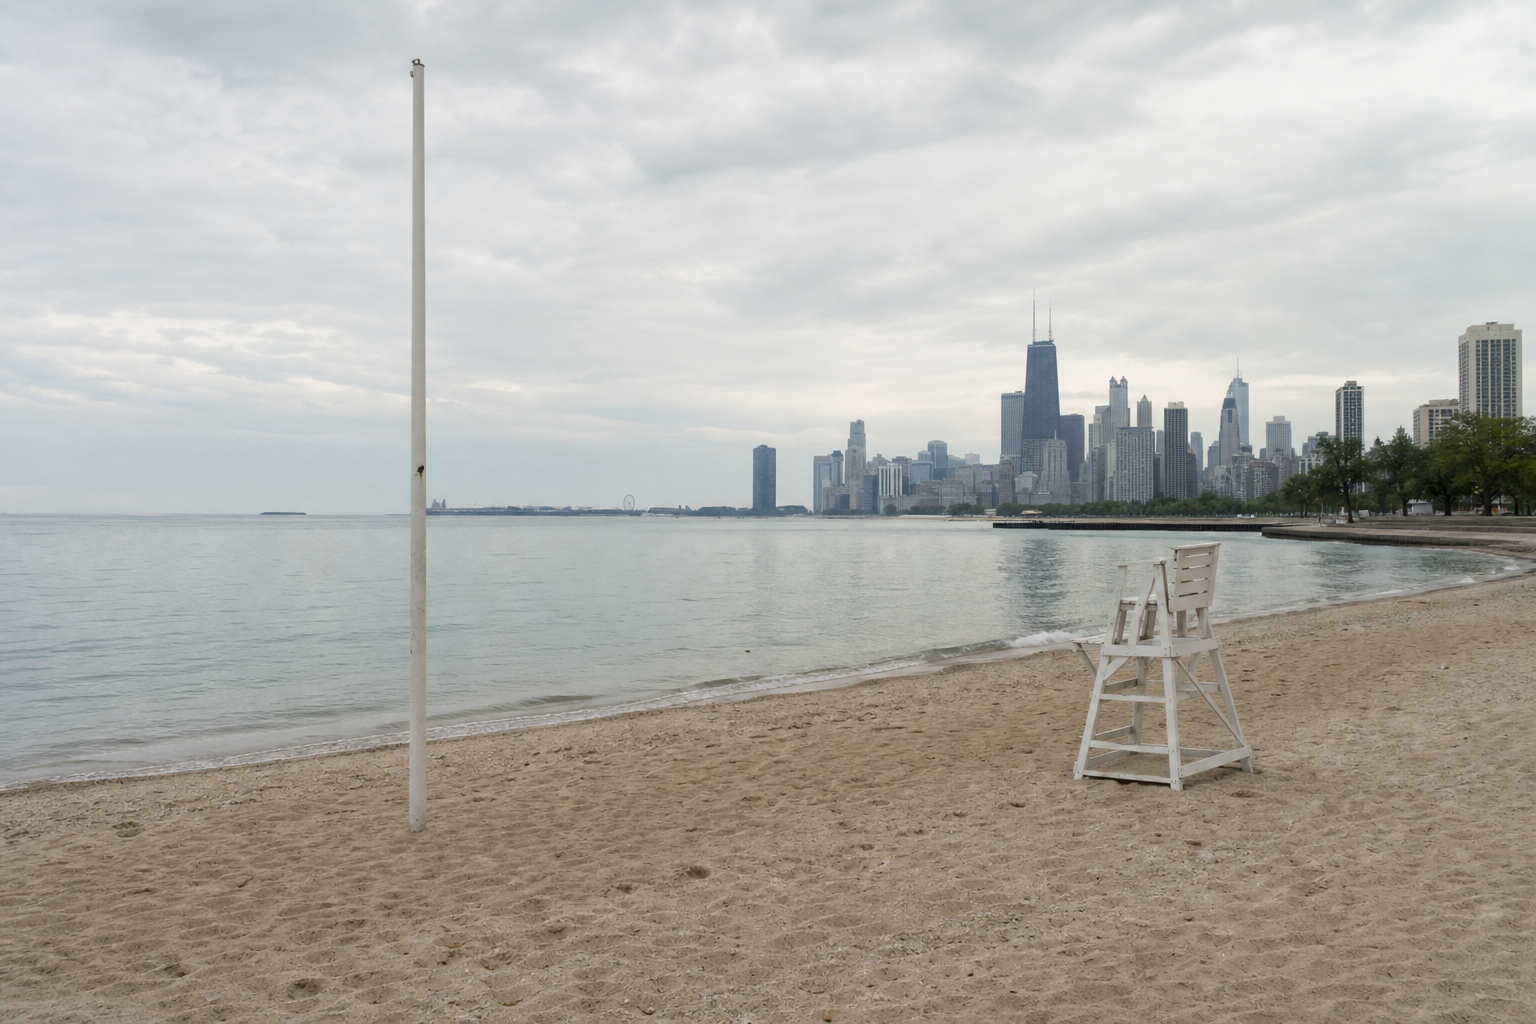

Chicago’s 2026 beach sampling season ran to September 7, the last day in the Park District’s lab file, and 57 of its 1,898 rapid water tests came back above 1,000 CCE — the level the file ties to a yellow swim advisory flag. That is 3.0 percent of the season’s readings, the second-lowest rate in the twelve summers the rapid test has been in the file, behind 2023’s 2.3 percent. At North Avenue, none of 107 readings crossed the line.
Beach Lab Data (2ivx-z93u), 34,967 test records at 31 beach names, retrieved September 16, 2026; the file was last updated September 7, 2026 · the 2026 season here means the 1,898 rapid-test readings taken May 22 through September 7 at 18 beaches · the thresholds are the file’s own: it says a yellow advisory flag follows readings above 1,000 CCE on the rapid DNA test and followed readings above 235 CFU on the retired culture test · the file records readings, not flags, so no advisory is said here to have been raised · the two methods measure different organisms in different units and their rates are never comparedThe season, beach by beach
| Beach, as named in the file | Rapid tests | Readings above 1,000 CCE | Share |
|---|---|---|---|
| Humboldt | 73 | 9 | 12.3% |
| Margaret T Burroughs (31st) | 107 | 8 | 7.5% |
| 63rd Street | 107 | 6 | 5.6% |
| Marion Mahony Griffin (Jarvis) | 107 | 5 | 4.7% |
| Montrose | 109 | 5 | 4.6% |
| 12th Street | 106 | 4 | 3.8% |
| Ohio Street | 108 | 4 | 3.7% |
| Calumet | 105 | 3 | 2.9% |
| Hartigan (Albion) | 108 | 2 | 1.9% |
| Leone | 108 | 2 | 1.9% |
| Rainbow | 108 | 2 | 1.9% |
| South Shore | 109 | 2 | 1.8% |
| Oak Street | 105 | 1 | 1.0% |
| 57th Street | 107 | 1 | 0.9% |
| Foster | 109 | 1 | 0.9% |
| Oakwood | 106 | 1 | 0.9% |
| Osterman | 109 | 1 | 0.9% |
| North Avenue | 107 | 0 | 0.0% |
Humboldt records the highest share, nine readings above the line out of 73 — and the fewest tests of any beach in the table, so its 12.3 percent rests on the smallest denominator of the eighteen and would move furthest on a single reading. Margaret T Burroughs (31st) follows at eight of 107 and 63rd Street at six of 107. Six beaches finished the season with one reading above the line or none at all, North Avenue with none — the same beach a longer-run ranking puts at the top of the lakefront.
Most readings are nowhere near the line
The median 2026 reading is 34 CCE, and three-quarters of the season’s readings are 89 or below — against a threshold of 1,000. Two readings are zero. The distribution is not symmetrical: the season’s highest single reading is 49,944 CCE, about fifty times the advisory level, while the middle of the season sits near 34. The 57 crossings come out of that long tail. A reading is a geometric mean of the samples taken at a beach that day, as the file defines it.
Twelve summers of the rapid test
| Season | Rapid tests | Readings above 1,000 CCE | Share |
|---|---|---|---|
| 2015 | 271 | 23 | 8.5% |
| 2016 | 629 | 28 | 4.5% |
| 2017 | 2,016 | 234 | 11.6% |
| 2018 | 1,966 | 289 | 14.7% |
| 2019 | 1,983 | 99 | 5.0% |
| 2020 | 47 | 13 | 27.7% |
| 2021 | 1,763 | 164 | 9.3% |
| 2022 | 1,710 | 71 | 4.2% |
| 2023 | 1,708 | 40 | 2.3% |
| 2024 | 1,786 | 102 | 5.7% |
| 2025 | 1,798 | 107 | 6.0% |
| 2026 | 1,898 | 57 | 3.0% |
Across the twelve dated summers the file holds 17,575 rapid readings, 1,227 of them above 1,000 CCE — 7.0 percent; a further 19 rapid readings carry an impossible date and sit outside every season below. The share has moved a long way inside that average: 14.7 percent in 2018 and 11.6 percent in 2017, then 2.3 percent in 2023 and 3.0 percent in 2026. Two years need reading with care. 2020’s 27.7 percent rests on 47 tests in the whole season, so thirteen readings set it, and one more crossing would lift it about a point and a half — a far more volatile figure than a share drawn from 1,900 tests. And 2015 and 2016 carry 271 and 629 rapid tests against 1,700 to 2,000 in the later full seasons, a difference in sampling the file records without explaining. What the file does not carry is a reason for any of these movements: it records readings, and nothing about weather, water or beach conditions.
Before the rapid test, a different organism and a different line
The file also holds the method it replaced. From 2006 through 2016 it carries 17,963 culture readings of E. coli in colony-forming units, 2,497 of them — 13.9 percent — above the 235 CFU line the file says brought a yellow flag in that era. Those two percentages, 13.9 and 7.0, are not comparable: the culture test counts a different organism in a different unit against a different threshold, and takes 18 to 24 hours where the rapid test takes four or five, as the file’s description sets out. The two overlap on 629 records that carry both a culture and a rapid reading, which is what a changeover looks like in a file.
What the file confirms, and what it cannot tell you
Confirmed, as recorded: each test’s beach, its timestamp and its reading, for both methods. The columns read here do not show: whether a flag was actually raised or a beach closed; why any reading was high; how many people swam; and what happened at the 13 beach names that carry no 2026 rapid test. The file also carries two impossible dates — a rapid timestamp in the year 23, on 19 readings, and a culture timestamp in the year 16 — which are excluded from the yearly tables and reported here rather than quietly dropped.
Where the record lives
The Beach Lab Data file sits on the city’s data portal, where it was last updated September 7, 2026 — the season’s last sampling day. Every figure here was computed from it as retrieved on September 16, 2026.
The bottom line
By the lab file, 2026 was a low season for threshold crossings: 3.0 percent of readings above the advisory level, against 14.7 percent in 2018 and 7.0 percent across the rapid test’s twelve summers. The two beaches with the highest shares account for 17 of the 57 crossings and six beaches had one or none, while the typical reading all season was 34 CCE — a thirtieth of the line. Why this summer’s share of readings above the threshold came in so far below 2018’s, the file does not say; a companion piece reads the beach-by-beach gap over the longer run.
Two more questions the file can answer
How often did the lab sample? On 109 separate days between May 22 and September 7, at 18 beaches — about one test per beach per sampling day. And how big is the gap between beaches? Humboldt’s nine crossings came in 73 tests; North Avenue had none in 107.
- Source: the Park District’s Beach Lab Data file (2ivx-z93u): 34,967 test records, retrieved September 16, 2026 and read whole.
- The thresholds are the file’s: its description says a yellow swim advisory flag follows rapid-test readings above 1,000 CCE of Enterococci, and followed culture readings above 235 CFU of E. coli. No reading in the file sits exactly on either number, so above and at-or-above give the same counts.
- Readings, not flags: the file records laboratory results. Whether a flag went up, or a beach closed, is not in it and is not claimed here.
- Columns read: beach, the rapid-test timestamp and geometric-mean reading, and the culture timestamp, mean reading and note. Coordinates were not selected; this page names beaches, not points.
- Seasons: a season is the calendar year of the rapid-test timestamp. 2026 runs May 22 to September 7, the file’s last sampling day; 2015 and 2016 are the file’s earliest rapid-test years; 2020 holds 47 tests. Nineteen rapid readings dated in the year 23 and the culture readings dated in the year 16 are excluded from yearly tables.
- Not compared: rapid and culture rates, which measure different organisms in different units against different thresholds.
Computed by KCM Desk from the Chicago Park District’s beach lab file, retrieved September 16, 2026. Human-guided and edited — about this desk. If you spot an error, corrections come first.
Related Keep Chicagoland Moving coverage
- How Chicago Works, by the Numbers
- Every Chicago Lakefront Beach, Ranked by Advisory-Level Water Tests
- Is Lake Michigan Warmer Than the Air? Chicago’s Paired Beach Sensors Recorded the Water Warmer on About One Matched Hour in Three
- Chicago Floated Water Sensors at Six Beaches. All but 39 of the 16,588 Hourly Records Since 2017 Carry an Error Code.