
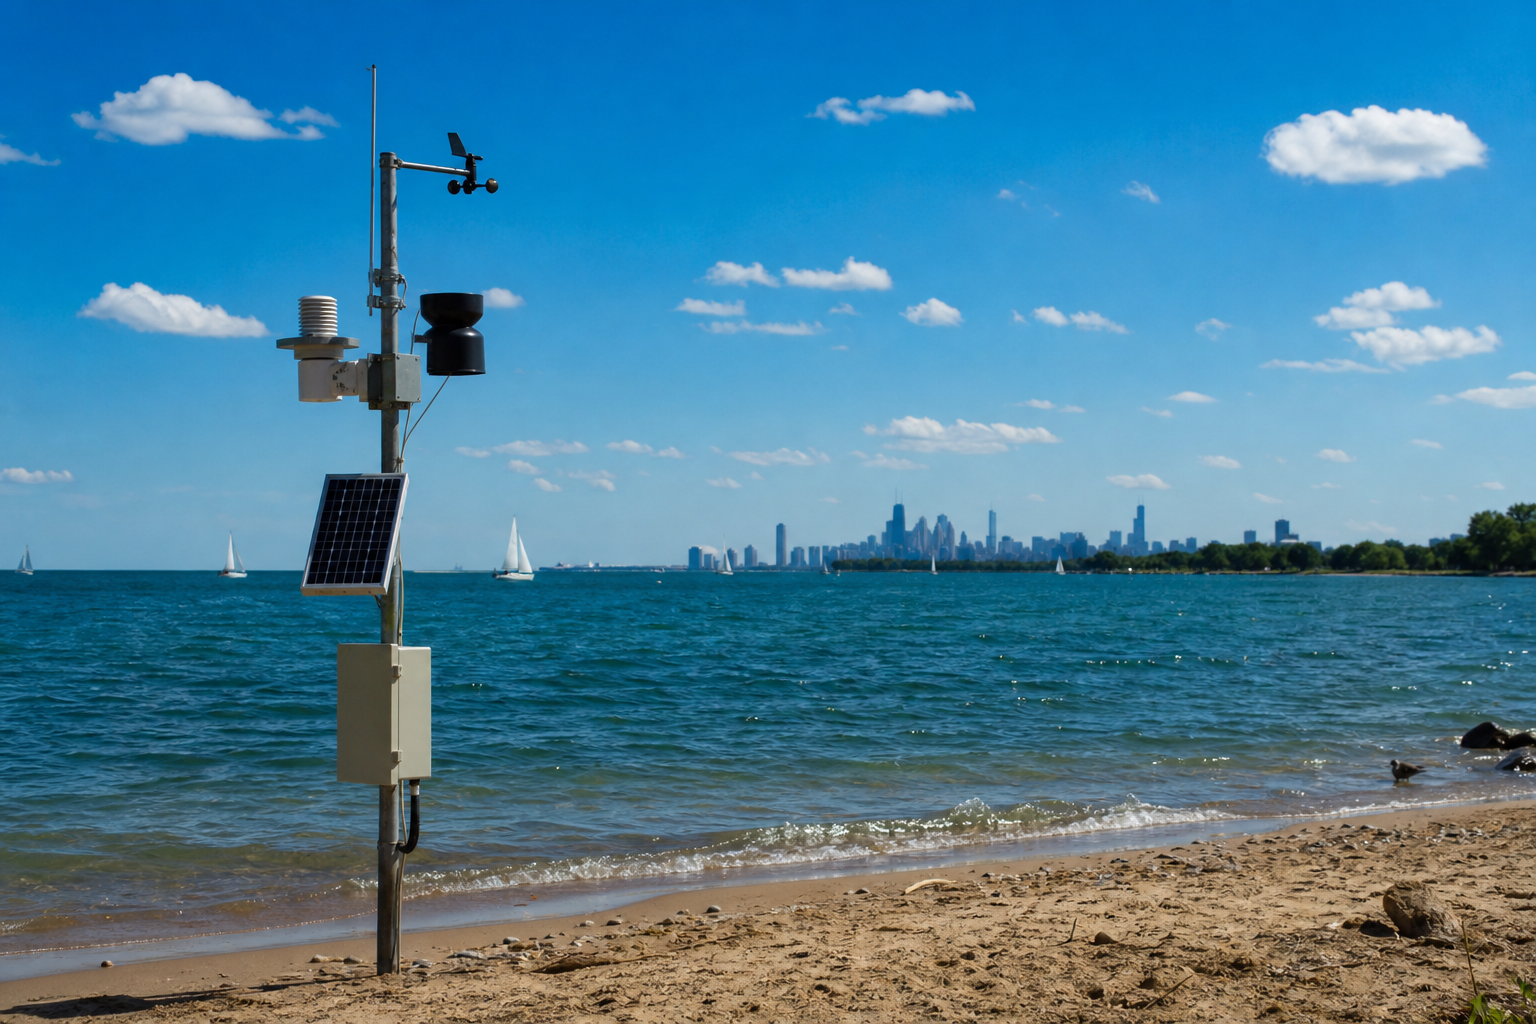

Is Lake Michigan warmer than the air above Chicago’s beaches? The Chicago Park District’s paired instruments — water sensors off its beaches and weather stations on its shore, whose file descriptions point readers to each other — recorded the water warmer on about one matched hour in three. The largest pairing, the Ohio Street water sensor against the Oak Street weather station 1,174 meters away, holds 16,076 matched hours across nine summers: the water read warmer on 33.9 percent of them, the air on 64.6 percent, and the two tied on 1.5 percent. Three smaller pairings from 2015 and 2016 land close by, at 30.9 to 32.1 percent. But one column in the weather file changes the answer in the largest pairing: on its hours when the Oak Street station filed a wind direction between 0 and 90 degrees at 2 meters per second or more, the Ohio Street water sensor read warmer on 79.3 percent.
Beach Weather Stations — Automated Sensors (k7hf-8y75), 208,984 hourly rows, and Beach Water Quality — Automated Sensors (qmqz-2xku), 48,906 rows, both read whole and retrieved September 15, 2026, with sensor coordinates from the Park District’s locations file (g3ip-u8rb) · the pairing, distances, time-of-day blocks, wind arcs and every percentage below are our computations from the filed rows · a water sensor out-reading an air station compares two instruments at two points; it is not a measurement of the lake, or the air, at large · nothing here speaks to swimming conditionsHow two files answer a question neither can alone
Neither file compares anything by itself. The weather file’s description points readers to the water file for “similar measurements on the lake water, itself,” and the water file points back “for a dataset with land-based weather measurements at selected beaches.” A third Park District file lists where each instrument sits, and by our calculation from its coordinates, four water sensors stand within 1,281 meters of a weather station: 63rd Street Beach, 409 meters from its station; Montrose Beach and Osterman Beach, 1,138 and 1,281 meters from the Foster station; and Ohio Street Beach, 1,174 meters from Oak Street’s. We matched each pair on identical filed timestamps, on the hour. Do the two files keep the same clock? Neither says, so we checked their daily rhythms: in July, average solar radiation peaks in the noon hour at one station and the 1 p.m. hour at the other, and both the air and the water readings bottom out at 5 a.m. and peak in mid-afternoon — the air at 3 p.m., the water at 4 p.m. That is consistent with both files keeping local clock time.
Some rows could not be paired. The water file carries 2,822 rows with error codes near −100,000 where a temperature belongs, and every one of them sits on the Ohio Street label between 2023 and 2025 — all 1,477 of its 2023 rows and 1,054 of its 1,061 rows in 2025 — so the Ohio Street pairing has no usable hours in either year, and none in 2022, when that label filed no rows at all. Blank air temperatures (75 rows) and readings filed off the hour (9 weather rows, 44 water rows) were set aside too.
The water reads warmer less than half the time, in every month the sensors share
| Water sensor | Weather station | Distance (ours) | Summers matched | Matched hours | Water warmer | Tied | Air warmer |
|---|---|---|---|---|---|---|---|
| Ohio Street Beach | Oak Street | 1,174 m | 2015–2021, 2024, 2026 | 16,076 | 33.9% | 1.5% | 64.6% |
| Montrose Beach | Foster | 1,138 m | 2015–2016 | 4,863 | 32.1% | 0.3% | 67.7% |
| Osterman Beach | Foster | 1,281 m | 2015 | 2,078 | 31.9% | 0.0% | 68.0% |
| 63rd Street Beach | 63rd Street | 409 m | 2015 | 1,624 | 30.9% | 1.0% | 68.0% |
| Month | Matched hours | Water warmer | Median gap, water minus air | Overnight (midnight–6 a.m.) | Afternoon (noon–6 p.m.) |
|---|---|---|---|---|---|
| May | 1,168 | 44.2% | −1.0°C | 49.6% | 41.2% |
| June | 4,208 | 26.6% | −2.9°C | 27.7% | 27.2% |
| July | 4,660 | 30.6% | −1.4°C | 33.7% | 31.0% |
| August | 4,257 | 39.2% | −0.5°C | 47.6% | 32.8% |
| September | 1,783 | 40.2% | −0.6°C | 35.8% | 46.0% |
June is where the air leads widest — the median matched hour had the water sensor 2.9 degrees Celsius below the air station — and the gap narrows through August and September, when the median sits within a degree. Narrowing is not flipping, though. The closest this pairing came to a water majority was May’s overnight hours, at 49.6 percent of 280. Across all four pairings, exactly one month-and-time block crossed half: June evenings at Osterman Beach against the Foster station, 55.2 percent of 172 hours, all in 2015. Is Oak Street’s station simply reading warm? It reads warmest of the three, as a section below shows — but the Montrose and Osterman sensors, paired with Foster, the coolest-reading station, still read warmer than the air on only 32.1 and 31.9 percent of their hours.
So when does Ohio Street’s water read warmer? When Oak Street’s wind direction reads 0 to 90 degrees
If the water usually reads cooler, when does it read warmer? The weather file holds a candidate in its own columns: wind direction, filed in degrees. Before using it we read the file’s note on the wind unit’s heading — “The ideal value to get the most accurate measurements is true north (0 degrees)” — and kept only hours when the Oak Street unit’s filed heading sat within 10 degrees of north, which covers 74,037 of its 76,526 rows, or 96.7 percent; a 2019 stretch filed near 320 degrees drops out. That leaves 13,676 of the Ohio Street–Oak Street matched hours with a usable direction, grouped here into four 90-degree arcs.
| Filed wind direction | Matched hours | Water warmer, any wind speed | At 2 m/s or more | At 4 m/s or more |
|---|---|---|---|---|
| 0–90° | 5,386 | 52.2% | 79.3% of 2,208 | 90.1% of 757 |
| 90–180° | 3,924 | 25.8% | 33.8% of 1,016 | 51.7% of 58 |
| 180–270° | 1,607 | 20.0% | 16.2% of 371 | 0.0% of 4 |
| 270–360° | 2,759 | 23.6% | 26.0% of 485 | 61.1% of 18 |
Across the four arcs at any wind speed, 0 to 90 degrees is the only one where the water read warmer on more than half of matched hours — 52.2 percent — and that share climbs with every step of filed wind speed: 65.0 percent at 1 meter per second or more, 79.3 at 2, 85.6 at 3 and 90.1 at 4. At 2 meters per second, about 4.5 miles per hour by our conversion, it holds in every month the pairing covers, from 76.5 percent in July to 88.4 in May. The 180-to-270-degree arc runs the other way, from 20.0 percent at any speed down to 15.7 at 3 meters per second.
What do those degrees mean on the shore? The weather file never defines them. The National Weather Service defines wind direction as “The true direction from which the wind is blowing at a given location”; if the file follows that convention, 0 to 90 degrees is wind out of the north and east — the lake side of Chicago’s shoreline — and 180 to 270 is wind out of the south and west, the land side. Our reading, labeled as ours: the two files show wind direction and the water-air gap moving together, and they hold nothing that could explain why — no current, no offshore temperature. What the pairing does establish is narrower, and counted: grouped by arc at any wind speed, the water sensor out-read the air station on most matched hours in one arc only.
Which lakefront station reads warmest? The same one, all year
The weather file answers a second question the pairing raises. On the 71,638 hours the Oak Street and Foster stations both filed, Oak Street read warmer on 97.0 percent — by a median 1.04 degrees Celsius — and its share never fell below 95.2 percent in any calendar month. The 63rd Street station read warmer than Foster on 83.3 percent of 45,754 shared hours, and Oak Street read warmer than 63rd Street on 69.5 percent of 40,371, with 5.2 percent tied. Each of those orderings held in all twelve calendar months: Oak Street, then 63rd Street, then Foster. Is the Oak Street shore warmer, or is it the instrument? The file cannot separate a place from the thermometer standing in it. It does record one more difference between those two stations: average July solar radiation peaks at 625.1 watts per square meter at Oak Street and 393.1 at Foster. The file does not connect the two differences, and neither does this page.
The record hours, checked against a second station
The weather file’s coldest reading is −29.78°C (−21.6°F), filed by the Foster station at 8 a.m. on January 30, 2019; that same hour the 63rd Street station, 22,628 meters away, filed −28.5°C (−19.3°F). Its hottest is 37.6°C (99.7°F), filed by Oak Street at 3 p.m. on August 24, 2023, while Foster, 8,538 meters away, filed 37.28°C (99.1°F). Were these glitches? Two instruments landing within 1.28 and 0.32 degrees of each other in the same hour is not proof of the true temperature — but it is a check a lone sensor cannot offer. The water file’s strangest morning, in September 2024, came in a year when Ohio Street was the only water sensor label filing at all, so no second water sensor was running to offer that same-hour comparison.
The weather file also carries values that read as codes, counted here and used in no figure on this page: six rows with wind values of 999.9; one gust reading of 445.2 meters per second, 16.9 times the next-highest gust in the file and filed at an off-the-hour 11:25 a.m.; six rows with zero barometric pressure and one above 1,100 hPa; six with zero humidity; and one negative rainfall.
What the files confirm, and what they cannot tell you
Confirmed, from the rows: what each instrument filed, hour by hour, and — by our matching — how often a water sensor’s reading exceeded a nearby air station’s, overall, by month, by time of day and by the station’s filed wind direction. What no row holds: the temperature of the lake or the city at large, since every figure compares two instruments at two points; whether a shore is warmer or cooler than inland, since every instrument here sits at the lakefront; why the water reads cooler most hours, or why the 0-to-90-degree hours differ, since the files record the pattern and not the physics; where each sensor sat in past summers, since the locations file is current and the water file warns placements change; and anything about swimming, which belongs to the Park District’s bacteria testing, a different record.
Where the record lives
Three Park District files on the city portal hold every filed fact above: the weather stations, the water sensors and the sensor locations. The water file’s own history — a six-beach network narrowed to one label — is this site’s earlier read. Every figure here recomputes from the files as retrieved September 15, 2026; both add rows as their sensors report, so later queries will see more.
The bottom line
Is Lake Michigan warmer than the air above Chicago’s beaches? By the Park District’s paired sensors, on about one matched hour in three — 33.9 percent in the largest pairing and 30.9 to 32.1 in three smaller ones — and in no month more than half. The exception has a direction: in the largest pairing, when the Oak Street station’s filed wind direction read between 0 and 90 degrees at 2 meters per second or more, the Ohio Street water sensor read warmer on 79.3 percent of hours. The files cannot say why. They can say when.
Two more questions the files can answer
Do the weather stations run only in summer? The file’s description says its sensors capture readings “hourly while the sensors are in operation during the summer,” yet the Foster and Oak Street stations filed rows in every month of 2025, and the file’s coldest reading came in January. The 63rd Street label, by contrast, filed at least 4,372 rows in every year from 2015 through 2022 and just 18 since, the last at 12:30 a.m. on March 18, 2025. And did the quiet labels ever stir? On March 17 and 18, 2025, both files’ long-quiet labels filed rows on the same two dates: the weather file’s 63rd Street station and the water file’s five dormant beach sensors. Neither file says why.
- Sources: the Chicago Park District’s Beach Weather Stations — Automated Sensors (k7hf-8y75, 208,984 rows) and Beach Water Quality — Automated Sensors (qmqz-2xku, 48,906 rows), both read whole, and the sensor locations file (g3ip-u8rb), all retrieved September 15, 2026; the wind-direction definition is the National Weather Service glossary’s.
- Pairing (ours): water and air rows matched on identical on-the-hour filed timestamps. Water rows with codes below −1,000 (2,822), blank (8) or filed off the hour (44) were excluded, as were blank (75) or off-hour (9) weather rows; ties are counted separately. Time blocks group the filed hour: overnight 0–5, afternoon 12–17, evening 18–23. Distances are straight lines between the locations file’s coordinates; Fahrenheit and miles-per-hour figures are our conversions.
- Checks (ours): both files’ July hourly averages — solar radiation peaking at noon and 1 p.m., air and water readings lowest at 5 a.m. — are consistent with local clock time; neither file states a time zone. Wind arcs use only Oak Street hours whose filed unit heading sat within 10 degrees of north, per the file’s own heading note; each arc includes its lower bound and excludes its upper one, with 360 counted as 0; and speed cutoffs from 0 to 4 meters per second are all shown, so no single cutoff carries the finding.
- Not here: no statement about the lake or the city at large, no inland comparison, no mechanism behind any pattern, no forecast and no swimming guidance; every relationship on this page is an association between filed columns.
Computed by KCM Desk from three Park District sensor files, retrieved September 15, 2026. Human-guided and edited — about this desk. If you spot an error, corrections come first.
Related Keep Chicagoland Moving coverage
- How Chicago Works, by the Numbers
- Chicago’s First Freeze at O’Hare Moved From a Median October 12 to October 28 Between 1966–1995 and 1996–2025. The Frost-Free Season Grew to 185 Days
- Chicago Floated Water Sensors at Six Beaches. All but 39 of the 16,588 Hourly Records Since 2017 Carry One Beach’s Label — Ohio Street, Whose July 2026 Averaged 73.8°F
- Chicago Measures Its Own Air Now: 286 Sensors, 2,544,089 Hourly Readings — and 96 Percent of Its 100-Plus PM2.5 Hours Landed on Two July Dates
- The Yellow Flag Flies 7 Times as Often at One Chicago Beach as at Another