
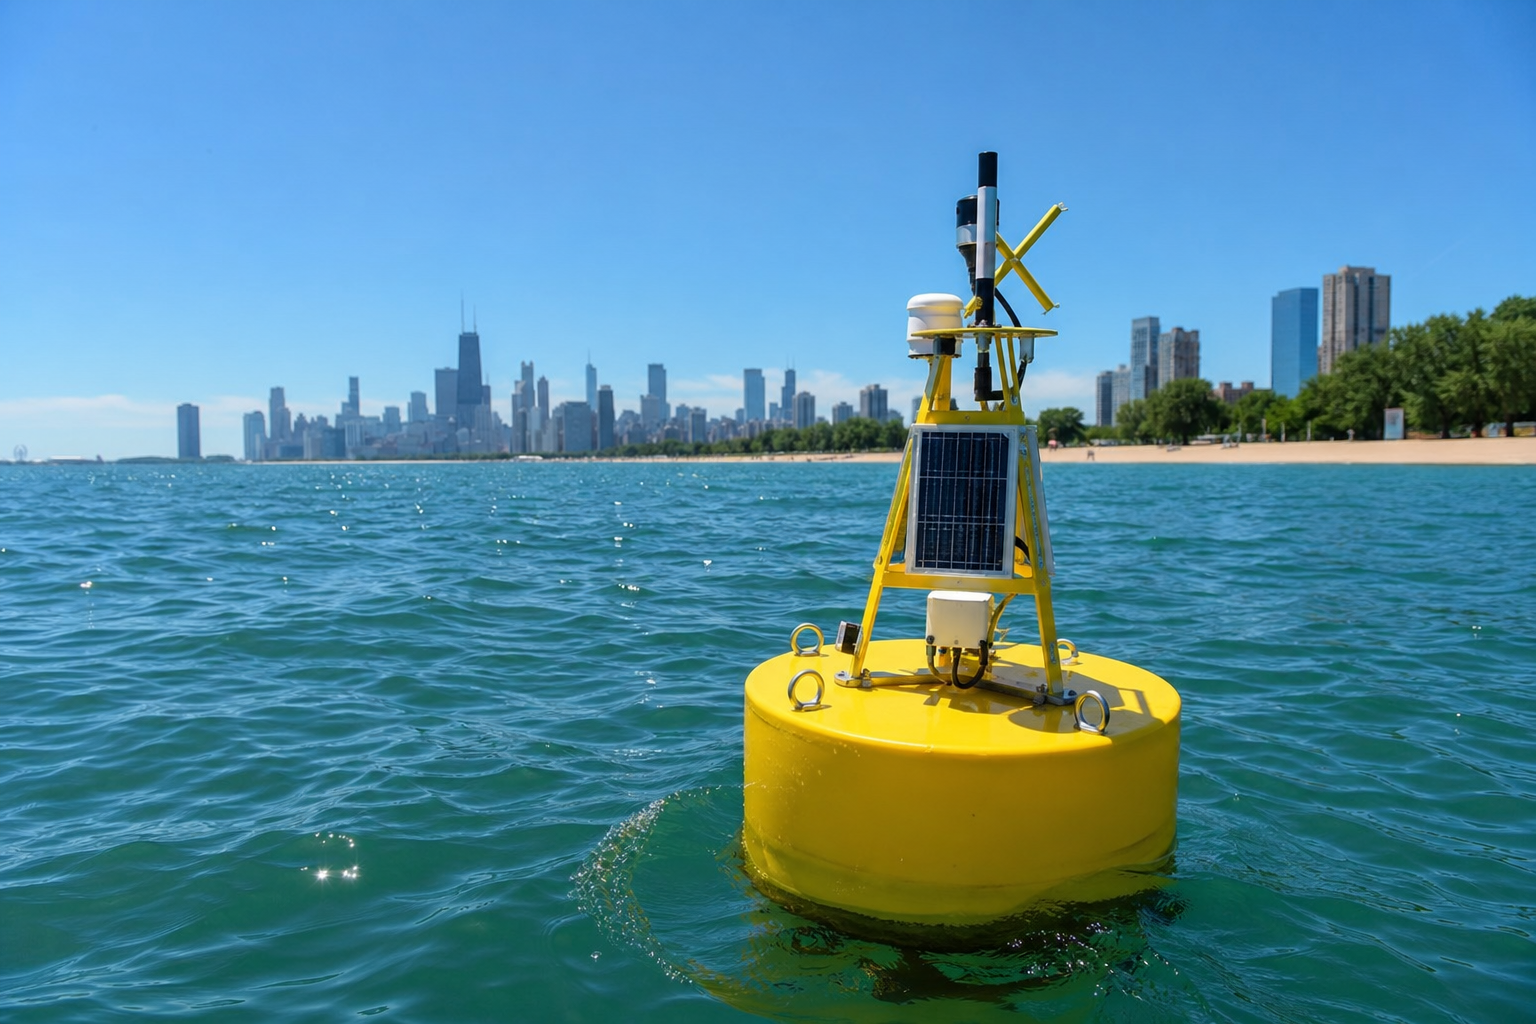

How warm is Lake Michigan, hour by hour? Chicago keeps an answer in a file: 48,791 hourly records from in-water sensors the Park District has floated off its beaches since 2013 — temperature, turbidity, wave height, wave period. But the file’s biggest fact is its shape. Six beaches carried sensors in the mid-2010s; of the 16,588 hourly records filed since 2017, all but 39 carry one beach label — Ohio Street Beach — and in 2026 that survivor filed 2,223 readings covering 98.6 percent of its June-to-September window’s hours, the freshest of them at 8:00 a.m. on the morning this page was retrieved. Its July averaged 23.2°C — 73.8°F — and its warmest hour touched 81.1°F.
Beach Water Quality — Automated Sensors (qmqz-2xku), 48,791 hourly rows retrieved September 10, 2026, read whole · 3,471 rows carry obvious error codes in one or more measurement columns (values near −100,000), excluded from every measurement figure here — the coverage counts, which tally records, include them — counted and disclosed · this is the PHYSICAL sensor file — it holds no bacteria measurement, and no sentence on this page speaks to whether any water was fit to swim in · the dataset’s own caveat: sensors report “hourly while the sensors are in operation during the summer,” and at other times “information from the sensors may not be available”This is the other beach file
Keep Chicagoland Moving has read Chicago’s beach records twice before — both times from the Park District’s bacteria lab tests, the rapid DNA measurements behind the yellow flag and the advisory-level ranking. This file is a different instrument entirely: hardware floating in the water, logging what the lake was doing every hour — how warm, how murky in Nephelometric Turbidity Units, how tall and how frequent the waves. The lab file answers a health-adjacent question with a lab method; this file answers a physical one with a thermometer. Neither can stand in for the other, which is exactly why the site now holds both.
Six beaches instrumented; one file speaking
| Beach | 2013 | 2014 | 2015 | 2016 | 2017 | 2018 | 2019 | 2020 | 2021 | 2022 | 2023 | 2024 | 2025 | 2026 |
|---|---|---|---|---|---|---|---|---|---|---|---|---|---|---|
| Ohio Street Beach | 1 | 2,002 | 1,998 | 2,627 | 2,714 | 1,948 | 2,603 | 304 | 934 | — | 1,477 | 3,285 | 1,061 | 2,223 |
| Montrose Beach | 1 | 2,225 | 2,518 | 2,524 | — | — | — | — | — | — | — | — | 6 | — |
| Osterman Beach | 1 | 1,808 | 2,213 | — | — | — | — | — | — | — | — | — | 6 | — |
| Calumet Beach | 1 | 2,127 | 2,991 | 2,450 | — | 1 | — | — | — | — | — | — | 6 | — |
| 63rd Street Beach | 1 | 1,160 | 2,258 | — | — | — | — | — | — | — | — | — | 6 | — |
| Rainbow Beach | — | 934 | 2,363 | — | — | — | — | — | — | — | — | — | 6 | — |
Read across, the table is the network’s autobiography. The file opens with five lone records — one row per beach, five different moments scattered between August 30 and September 18, 2013 — then fills out: by 2015, all six beaches are filing by the thousand. From 2017 on, the column belongs almost entirely to Ohio Street — all but 39 of 16,588 records. Why did the network contract? The dataset’s own description is as far as this page will go: “sensor locations change with the Park District’s operational needs, primarily related to water quality.” In 2025 the five silent beaches blink awake for exactly six rows apiece — a cameo the file records without comment — and 2026 is, again, one beach. Ohio Street’s own history has gaps too: 304 rows in 2020, nothing at all in 2022, as filed. A record is not always a reading, though: since 2017, 2,822 of Ohio Street’s 16,549 records carry an error code where the water temperature would be — all 1,477 it filed in 2023, 291 in 2024 and 1,054 of 1,061 in 2025 — and one more leaves it blank, so the label’s usable water-temperature readings since 2017 number 13,726. Counted by usable temperatures instead of records, its 2023 holds none and its 2025 holds six. And the 39 records since 2017 that do not carry the Ohio Street label split two ways: 31 from the five other beaches — Calumet’s lone 2018 row plus the 2025 cameos — and 8 under a seventh label, “Old — Ohio Street Beach,” filed between August 27, 2021 and July 7, 2025. Whether that legacy label names the same water as the live one is not something the file states, so this page counts by the labels as filed and draws nothing more from them.
Summer 2026, in one sensor’s hours
| Month (2026) | Mean water temperature |
|---|---|
| June (from June 8) | 18.1°C / 64.6°F |
| July | 23.2°C / 73.8°F |
| August | 23.1°C / 73.6°F |
| September (through Sept 10) | 22.7°C / 72.9°F |
The season’s shape, in the sensor’s own numbers: the water came up 5.1 degrees Celsius from June to July, held through August — July beat August by exactly one tenth of a degree — and was still 22.7°C into September, 4.6 degrees above its June mean. The coldest hour it filed all summer was 15.7°C (60.3°F) at 5:00 a.m. on June 15; the warmest, 27.3°C (81.1°F) at 6:00 p.m. on July 18. The waviest hour of its 2026 was a half-meter reading on the evening of August 1 — about a third of the tallest wave anywhere in the file’s thirteen years, the in-file yardstick and the only one this page uses.
The strange morning of September 10, 2024
The three warmest numbers in the entire file were filed within four hours of one another, by the Ohio Street sensor, on September 10, 2024 — two years to the day before this page’s retrieval. As filed: 13.5°C at 7:00 a.m., then 16.2, then 20.2, then 37.3°C at 10:00 — 99.1°F, the file’s all-time maximum — back down to 24.1 at 11:00, up again to 34.7 at noon, 29.8 at 1:00 p.m., and a smooth glide down through the afternoon. Through the spike hours the same rows file exactly 0 for turbidity and 0 for wave height. This page prints that morning as the file holds it and claims nothing about the lake from it: a 24-degree-Celsius swing inside three hours is an anomalous sequence in the filed readings, from whatever part of the collection it came, and the dataset carries no quality-control flag column with which to say more.
Waves and murk, as filed
The biggest wave in the file belongs to the old six-beach era: 1.467 meters — about 4.8 feet — at Osterman Beach at 10:00 p.m. on July 8, 2015, with the next-tallest, 1.229 meters, at Ohio Street on an early June morning in 2019. The murkiest reading is 1,683.48 NTU at 63rd Street Beach in the summer of 2014 — a figure the column hits twice that season, against a file where readings above 1,000 NTU occur just seven times in thirteen years. And the excluded rows deserve their count stated plainly: 3,471 rows carry sentinel values near −100,000 — 2,822 in the temperature and turbidity columns, the temperature codes all on Ohio Street records from 2023 through 2025, and 649 in the wave pair — error codes filed where measurements would go, removed from every measurement figure above — means, extremes, the 2026 season — and never interpreted; the coverage table counts them as the records they are.
What the file confirms, and what it cannot tell you
Confirmed, from the rows and the dataset’s own column notes: what each floating sensor measured, when, and in what units — Celsius for water temperature, NTU for turbidity, meters and seconds for the waves, and even the battery, logged as voltage. What no row holds: any bacteria measurement — bacteria-based water-quality advisories come from the lab-test file linked above — nor why the network contracted to one beach beyond the description’s operational-needs sentence, nor the temperature of the lake at large: one sensor is one point of water at one beach. A quiet year in a beach’s column means the file holds no rows for it, and nothing more.
Where the record lives
Three records complete this one. The sensor file itself, updating hourly in season — every figure here recomputes against the file as it stood at retrieval on September 10, 2026, and a live file will have moved past those totals by the time you query it. The land-side companion the description points to — weather stations at selected beaches, a file this site has since paired with this one, hour by hour. And the sensor locations dataset, which maps where the instruments sit — locations the description warns “change with the Park District’s operational needs.”
The bottom line
Chicago’s in-water beach sensor file is two stories in one ledger. The first is a lake summer told hourly: 18.1°C in June, 23.2 in July, 23.1 in August, 22.7 into September, one 81-degree-Fahrenheit hour on a July evening. The second is the ledger itself: a six-beach network whose file has carried one label on all but 39 of its records since 2017, filed a five-beach cameo in 2025, and in 2026 kept its remaining instrument running for 98.6 percent of the hours in its window. Both stories are printed here as filed — and what bacteria tests showed, which this file cannot say, belongs to the lab file this site read first.
Two more questions the file can answer
Is the lake warmer in July or August? By this sensor’s 2026 means, July — by one tenth of a degree Celsius, 23.2 to 23.1. Does anything in the file say how the sensors are doing? Yes — the file logs its own batteries. The battery_life column is, per the dataset’s own note, “battery voltage, an indicator of remaining battery life” — the instrument reporting on itself, hourly, alongside the lake.
- Source: the Chicago Park District’s Beach Water Quality — Automated Sensors (qmqz-2xku): 48,791 hourly rows, the whole file, retrieved September 10, 2026 — a live file whose totals will have moved by the time you read this.
- Grain and cleaning: one row per beach per hour while a sensor operates, per the dataset’s own description, counted here as records — the coverage table counts records, error-coded ones included, and usable water-temperature readings are counted separately; 3,471 rows carrying sentinel error codes below −1,000 in any measurement column were excluded from every measurement figure and are counted in the text; 45,320 clean rows remain. Fahrenheit and feet conversions are ours; everything else is the file’s.
- Extremes: printed as FILED readings with their timestamps, never as lake history — the file carries no quality-control flag, and the September 10, 2024 morning is presented with its full context for the reader to weigh.
- Not here: no bacteria figure, no advisory, no statement about swimming conditions past or present — bacteria results are in the Park District’s lab-test file, read in this site’s earlier beach pieces; and no explanation for the network’s contraction beyond the description’s own sentence, quoted above.
Computed by KCM Desk from the Park District’s in-water sensor file, retrieved September 10, 2026; updated September 15, 2026 to count records and usable water-temperature readings separately. Human-guided and edited — about this desk. If you spot an error, corrections come first.
Related Keep Chicagoland Moving coverage
- Is Lake Michigan Warmer Than the Air? Chicago’s Paired Beach Sensors Recorded the Water Warmer on About One Matched Hour in Three
- Chicago’s Top 10 Parks, Ranked by Variety: Lincoln Lists 36 Kinds of Facilities and the Top Ten Is a Clean Cut — per the Portal’s Newest Inventory, Stamped 2016
- How Chicago Works, by the Numbers
- The Yellow Flag Flies 7 Times as Often at One Chicago Beach as at Another
- Every Chicago Lakefront Beach, Ranked by Advisory-Level Water Tests
- Chicago Measures Its Own Air Now: 286 Sensors, 2,544,089 Hourly Readings — and 96 Percent of Its 100-Plus PM2.5 Hours Landed on Two July Dates