
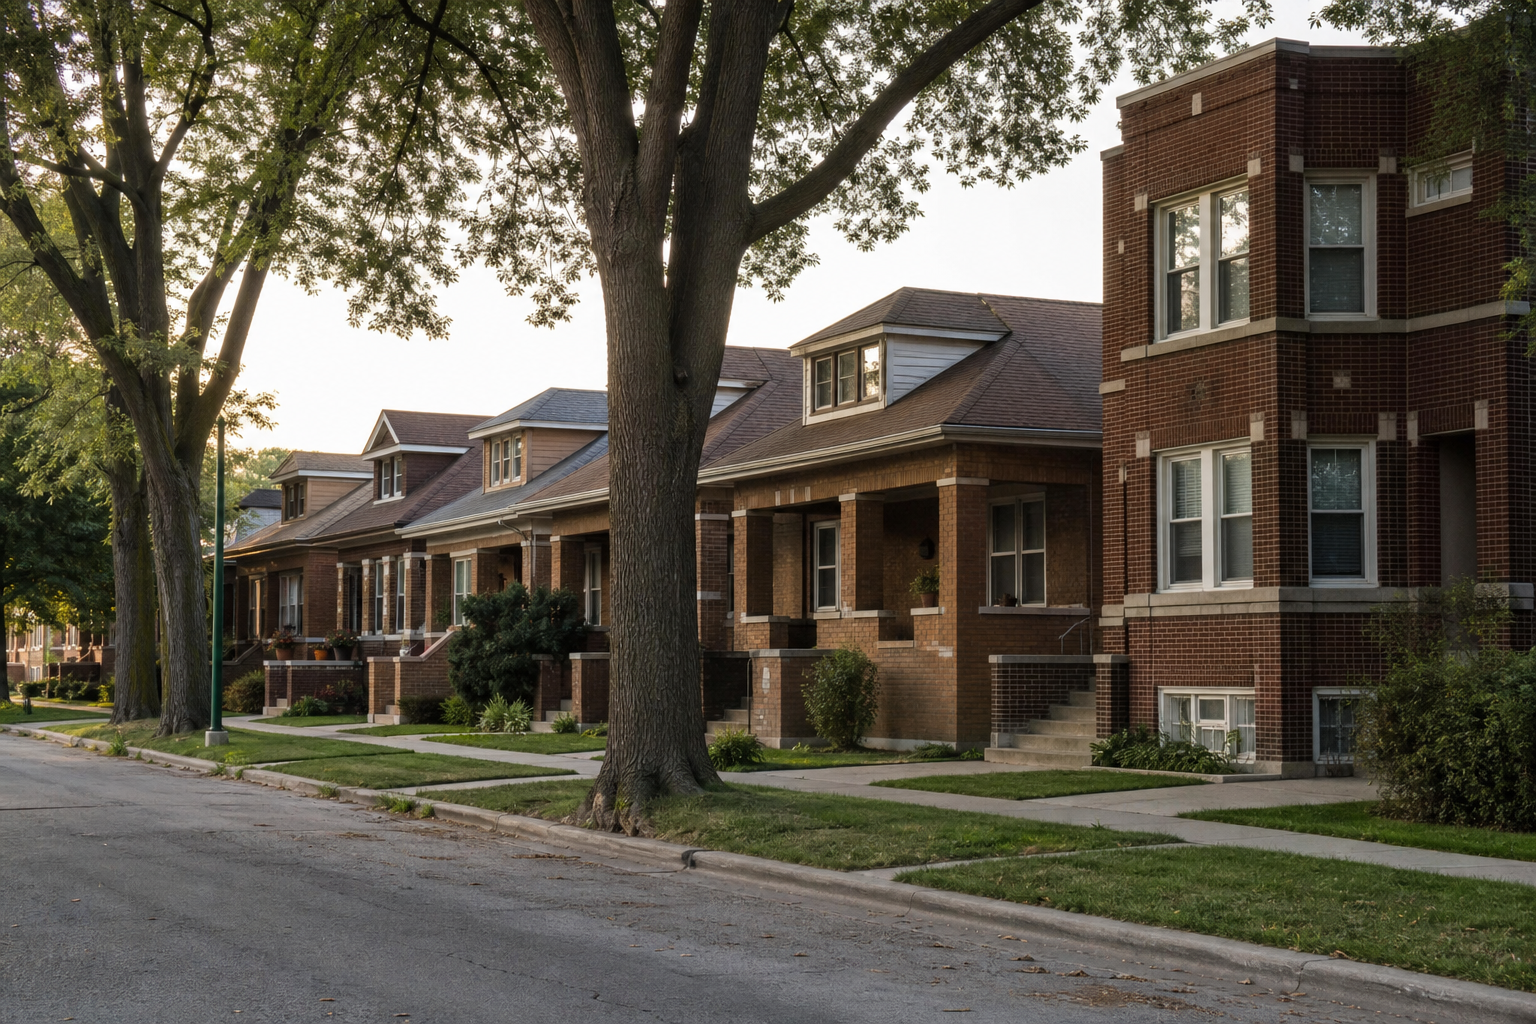

Just over half of the houses and small apartment buildings in the Cook County Assessor’s 2025 records — 50.1 percent — were built in 1954 or earlier, and 24,481 of the 1.1 million — 2.2 percent — were built in 2010 or later. In the assessor’s eight Chicago townships the middle year is 1925 — at least half their buildings date from then or earlier — against 1960 in the county’s 30 suburban townships.
Single and Multi-Family Improvement Characteristics (x54s-btds), maintained by the Cook County Assessor’s Office, tax-year 2025 rows, retrieved September 18, 2026; last updated September 15, 2026 · one row per building: single-family houses and buildings of fewer than seven units, not condominiums · township names from the assessor’s Parcel Universe (pabr-t5kh) · counts by year built are buildings still in the 2025 rows, not how many went up in each decadeWhich decade left the most of what still stands?
| Decade built | Buildings in the 2025 rows | Share |
|---|---|---|
| Before 1900 | 81,608 | 7.4% |
| 1900s | 55,071 | 5.0% |
| 1910s | 72,651 | 6.6% |
| 1920s | 126,523 | 11.5% |
| 1930s | 24,156 | 2.2% |
| 1940s | 78,970 | 7.2% |
| 1950s | 246,168 | 22.3% |
| 1960s | 155,663 | 14.1% |
| 1970s | 91,070 | 8.3% |
| 1980s | 47,763 | 4.3% |
| 1990s | 52,448 | 4.8% |
| 2000s | 46,459 | 4.2% |
| 2010s | 15,268 | 1.4% |
| 2020 to 2025 | 9,213 | 0.8% |
The 1950s, with 246,168 buildings, 22.3 percent. That is more than the 1900s and 1910s together (127,722) and about three and a half times everything dated 2000 or later (70,940). The 1930s, the Depression decade, left 24,156, fewer than a fifth of the 1920s’ 126,523. Read the table as survival as much as construction: every building torn down since is missing from its decade, and the older a decade, the longer its buildings have had to disappear.
Chicago’s townships against the suburbs
| Area | Buildings | Middle year built | Built before 1940 | Built 2010 or later |
|---|---|---|---|---|
| Chicago’s eight townships | 439,409 | 1925 | 58.6% | 8,935 (2.0%) |
| The 30 suburban townships | 663,622 | 1960 | 15.4% | 15,546 (2.3%) |
| All of Cook County | 1,103,031 | 1954 | 32.6% | 24,481 (2.2%) |
In Chicago’s townships 58.6 percent of these buildings date from before 1940; in the suburban townships, 15.4 percent. Since 2010 the two sit close together: 2.0 percent of the city townships’ buildings and 2.3 percent of the suburban ones. By this measure the gap in age was set generations ago, and the recent pace of new building, relative to what stands, is about even.
Township by township
| Township | Group | Buildings | Middle year built | Built before 1940 | Built 2010 or later |
|---|---|---|---|---|---|
| South Chicago | Chicago | 16,487 | 1903 | 58.4% | 1,231 (7.5%) |
| West Chicago | Chicago | 65,664 | 1906 | 83.0% | 2,180 (3.3%) |
| Lake View | Chicago | 23,046 | 1908 | 70.9% | 1,800 (7.8%) |
| Oak Park | Suburban | 11,448 | 1916 | 87.3% | 141 (1.2%) |
| North Chicago | Chicago | 5,481 | 1920 | 53.4% | 402 (7.3%) |
| Cicero | Suburban | 13,767 | 1922 | 71.4% | 29 (0.2%) |
| Berwyn | Suburban | 12,994 | 1925 | 71.6% | 62 (0.5%) |
| Hyde Park | Chicago | 64,699 | 1926 | 55.4% | 808 (1.2%) |
| Evanston | Suburban | 13,171 | 1927 | 57.7% | 251 (1.9%) |
| Jefferson | Chicago | 112,919 | 1927 | 60.3% | 1,821 (1.6%) |
| River Forest | Suburban | 2,977 | 1927 | 62.2% | 73 (2.5%) |
| Rogers Park | Chicago | 7,814 | 1938 | 50.5% | 73 (0.9%) |
| Lake | Chicago | 143,299 | 1944 | 46.3% | 620 (0.4%) |
| Riverside | Suburban | 5,262 | 1947 | 39.1% | 40 (0.8%) |
| Leyden | Suburban | 23,297 | 1952 | 18.3% | 156 (0.7%) |
| Proviso | Suburban | 41,984 | 1952 | 30.2% | 245 (0.6%) |
| Calumet | Suburban | 4,730 | 1953 | 35.3% | 2 (0.0%) |
| New Trier | Suburban | 18,330 | 1954 | 36.6% | 1,188 (6.5%) |
| Niles | Suburban | 31,794 | 1956 | 4.5% | 518 (1.6%) |
| Norwood Park | Suburban | 8,214 | 1957 | 9.9% | 143 (1.7%) |
| Thornton | Suburban | 53,478 | 1957 | 17.1% | 44 (0.1%) |
| Lyons | Suburban | 30,466 | 1958 | 19.4% | 1,491 (4.9%) |
| Maine | Suburban | 35,463 | 1958 | 10.6% | 1,142 (3.2%) |
| Stickney | Suburban | 12,293 | 1958 | 5.0% | 212 (1.7%) |
| Worth | Suburban | 43,461 | 1958 | 8.5% | 329 (0.8%) |
| Bloom | Suburban | 27,442 | 1961 | 13.9% | 305 (1.1%) |
| Elk Grove | Suburban | 17,980 | 1963 | 1.8% | 156 (0.9%) |
| Wheeling | Suburban | 36,373 | 1965 | 3.3% | 956 (2.6%) |
| Bremen | Suburban | 32,865 | 1966 | 6.1% | 463 (1.4%) |
| Northfield | Suburban | 23,927 | 1970 | 2.9% | 1,942 (8.1%) |
| Palatine | Suburban | 27,519 | 1972 | 2.1% | 1,066 (3.9%) |
| Palos | Suburban | 14,003 | 1972 | 2.0% | 305 (2.2%) |
| Rich | Suburban | 22,475 | 1972 | 2.1% | 307 (1.4%) |
| Schaumburg | Suburban | 30,491 | 1973 | 0.1% | 512 (1.7%) |
| Barrington | Suburban | 5,577 | 1984 | 9.6% | 543 (9.7%) |
| Hanover | Suburban | 25,178 | 1985 | 1.3% | 576 (2.3%) |
| Orland | Suburban | 28,507 | 1987 | 0.5% | 993 (3.5%) |
| Lemont | Suburban | 8,156 | 1995 | 8.3% | 1,356 (16.6%) |
South Chicago township’s middle year is 1903, West Chicago’s 1906 and Lake View’s 1908; Oak Park, at 1916, is the oldest suburban township. At the other end, Lemont’s middle year is 1995, Orland’s 1987 and Hanover’s 1985. Old and new are not opposites here. Lake View (7.8 percent), South Chicago (7.5) and North Chicago (7.3) carry three of the six highest shares of buildings dated 2010 or later, and West Chicago holds the most of them in number, 2,180. Lake, the county’s largest township by this count with 143,299 buildings, has 620 — 0.4 percent. Lemont leads on share, with 1,356 buildings, 16.6 percent of its own.
Is Cook County adding to this stock?
| Tax year | Buildings in the file |
|---|---|
| 1999 | 1,059,702 |
| 2000 | 1,077,974 |
| 2001 | 1,078,951 |
| 2002 | 1,081,904 |
| 2003 | 1,085,834 |
| 2004 | 1,089,762 |
| 2005 | 1,093,404 |
| 2006 | 1,096,341 |
| 2007 | 1,098,544 |
| 2008 | 1,099,960 |
| 2009 | 1,099,466 |
| 2010 | 1,099,597 |
| 2011 | 1,099,010 |
| 2012 | 1,098,752 |
| 2013 | 1,098,025 |
| 2014 | 1,097,705 |
| 2015 | 1,098,115 |
| 2016 | 1,098,108 |
| 2017 | 1,098,637 |
| 2018 | 1,098,786 |
| 2019 | 1,098,966 |
| 2020 | 1,099,085 |
| 2021 | 1,099,631 |
| 2022 | 1,100,289 |
| 2023 | 1,101,227 |
| 2024 | 1,102,672 |
| 2025 | 1,103,047 |
Barely, by this file’s count. It grew every year from 2000 through 2008, by 21,986 buildings in all, then all but stopped: the 2025 count, 1,103,047, is the file’s highest, but only 3,087 above 2008’s, after a low of 1,097,705 in 2014. (1999, the file’s first year, holds 18,272 fewer rows than 2000, so this page measures growth from 2000.) The 2026 rows, which the file says are final only once the assessor certifies every township, hold 1,102,622 so far.
Set that beside the 24,481 buildings dated 2010 or later, and our arithmetic suggests the stock turned over more than it grew. If year built marks when a building went up — the field is labeled simply “Year built” — and the file counted buildings the same way in both years, then roughly 21,394 or more buildings in the 2008 rows are no longer in the 2025 rows: torn down, converted to condominiums, moved to another property class or otherwise dropped. That is our estimate from grouped counts, not a figure the file records, and corrections to year-built values or classes since 2008 would move it.
What the file confirms, and what it cannot tell you
Confirmed, as recorded: how many buildings the assessor lists by tax year, township and year built. Not shown: condominiums, which the file does not carry, and buildings of seven or more units; which buildings left and why; and anything about owners or occupants. This page read only grouped counts, never a parcel number or an address. The year-built field bunches at some round years — 8,011 buildings are dated 1910, against 3,807 in 1909 and 5,158 in 1911 — which we read as estimated dates for some older buildings, so decades are steadier than single years. Rows are buildings, not parcels: 15,281 sit on parcels with more than one building.
Where the record lives
The Single and Multi-Family Improvement Characteristics file and the current-year Parcel Universe, which supplied the township names, sit on Cook County’s data portal. Every figure here was computed from them as retrieved on September 18, 2026.
The bottom line
Cook County’s houses and small apartment buildings are mostly mid-century and older: just over half date from 1954 or earlier, and the 1950s left more of them than any other decade. Their count has barely moved since 2008, and 2.2 percent date from 2010 or later.
Three questions the file can answer
Which township’s middle year is the oldest? South Chicago’s, 1903. The newest? Lemont’s, 1995. Which decade left the most buildings still in the 2025 rows? The 1950s, with 246,168.
- Source: the Cook County Assessor’s Single and Multi-Family Improvement Characteristics file (x54s-btds), tax-year 2025 rows and each year’s row count, retrieved September 18, 2026.
- Read: grouped counts by tax year, township and year built; no parcel number, address or owner field selected.
- Townships: codes matched to names in the assessor’s current-year Parcel Universe (pabr-t5kh); the eight in its City triad are reported as Chicago’s.
- Middle year: counting from the oldest, the year by which at least half of the buildings with a recorded year had been built.
- Not here: condominiums, larger apartment buildings, and any cause for the patterns.
Computed by KCM Desk from the Cook County Assessor’s Single and Multi-Family Improvement Characteristics file, retrieved September 18, 2026. Human-guided and edited — about this desk. If you spot an error, corrections come first.
Related Keep Chicagoland Moving coverage
- Chicago Housing, by the Numbers
- Since 2008, Chicago’s Townships Lost 3,260 Houses and Small Apartment Buildings and the Suburbs Gained 6,351, by the Assessor’s Count
- Cook County’s Condo Count Grew 73 Percent From 1999 to 2010, by the Assessor’s Count — Then Leveled Off: 372,354 Units in 2025, 63 Fewer Than in 2010
- Chicago Loses a Two-to-Six-Flat Every Day: The Quiet Disappearance of the City’s Housing Ladder
- Lincoln Park Holds 1,590 of the 9,282 Properties Chicago’s Historic Survey Rated Red or Orange — About One in Six, While Four Community Areas Have None
- After the Wrecking Ball: A Rebuild Permit Follows at 84 Percent of Logan Square’s Demolished Sites, and at None of West Pullman’s 137