Englewood, by the Numbers: The Median House Went From $32,341 to $115,000, and 358 Two-to-Six-Flat Parcels Are Now Classed as Vacant Land

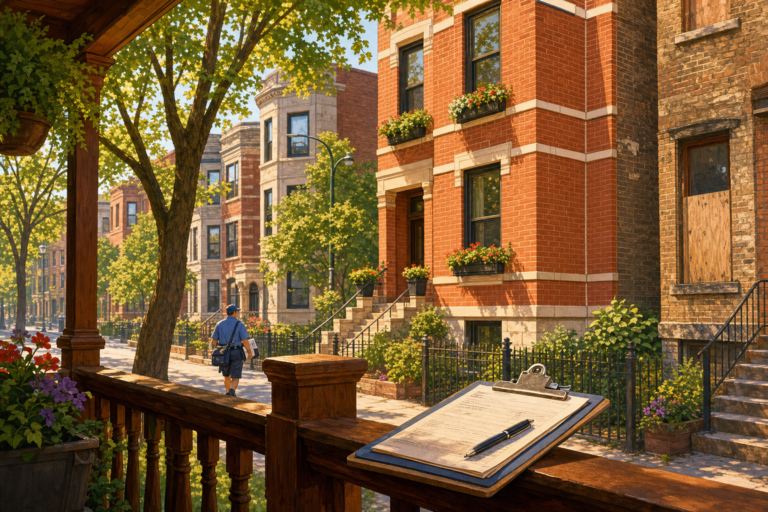
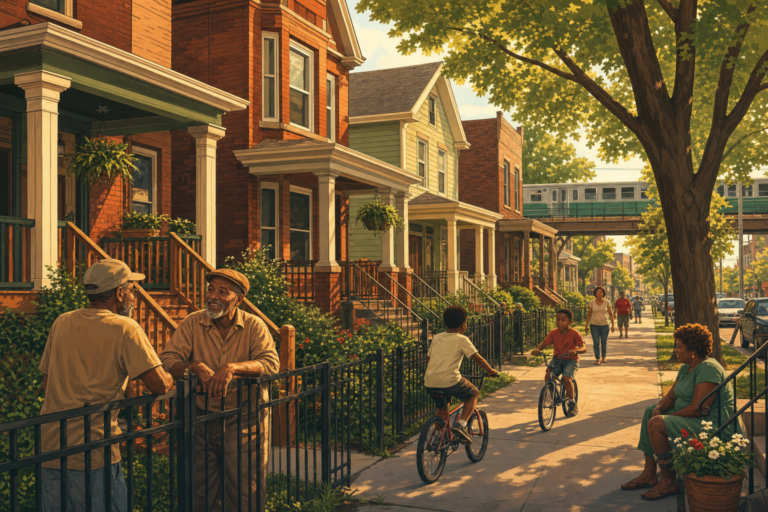
Illustration of an Englewood block of brick and frame houses with deep porches, a corner community garden, and the Green Line el in the distance

Englewood’s median house sold for $32,341 in 2019, the lowest of the 70 Chicago community areas with enough sales to compare, and $115,000 in 2025, the second-largest rise. Of the 3,030 parcels classed as two-to-six-flats there in 2006, 588 have left the class, and 358 of those are now classed as vacant land. Rebuilt September 30, 2026 on the county’s updated sales file.

Pullman, by the Numbers: The Median House Went From $68,900 to $178,000 on 63 Sales, and 15 Percent of Purchases Were Resold Within Two Years

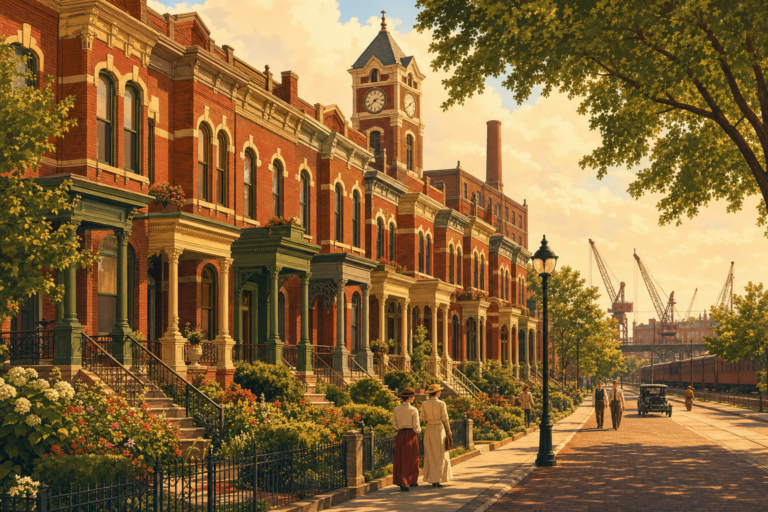
Illustration of historic Pullman rowhouses with the old factory clock tower behind them and rail-corridor construction cranes in the distance

Pullman’s median house sold for $68,900 in 2019 and $178,000 in 2025, the fourth-largest rise among the 70 Chicago community areas with enough sales to compare, on 63 sales. Of the 423 homes bought in the Far South Side area from 2018 through 2022, 63 were sold again by their buyer within two years, 15 percent against 7 percent citywide. Rebuilt September 30, 2026 on the county’s updated sales file.

Avondale, by the Numbers: House Prices Up 59 Percent Since 2019, No Market Signals Active, and 142 Two-to-Six-Flat Parcels Now Classed as Houses

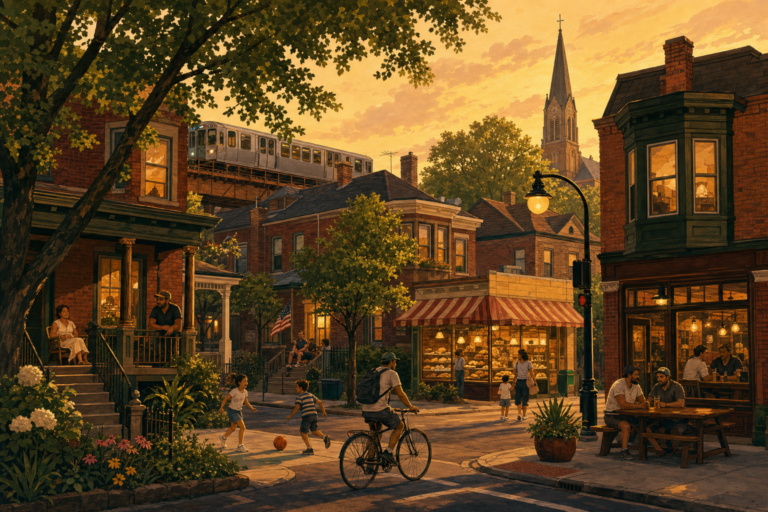
Illustration of an Avondale street of brick bungalows and two-flats with a corner tavern and the Blue Line passing behind the rooftops

Avondale’s median house sold for $437,500 in 2019 and $694,500 in 2025, up 59 percent against 39 percent citywide, and none of the five market signals in our analysis is active in the Northwest Side area. Of the 193 two-to-six-flats that left the Assessor’s count there since 2006, 142 are now classed as single-family houses. Rebuilt September 30, 2026 on the county’s updated sales file.

Woodlawn, by the Numbers: The Median House Price Tripled on 39 Sales, and the Tax Rolls Show More Two-to-Six-Flat Parcels Than in 2006

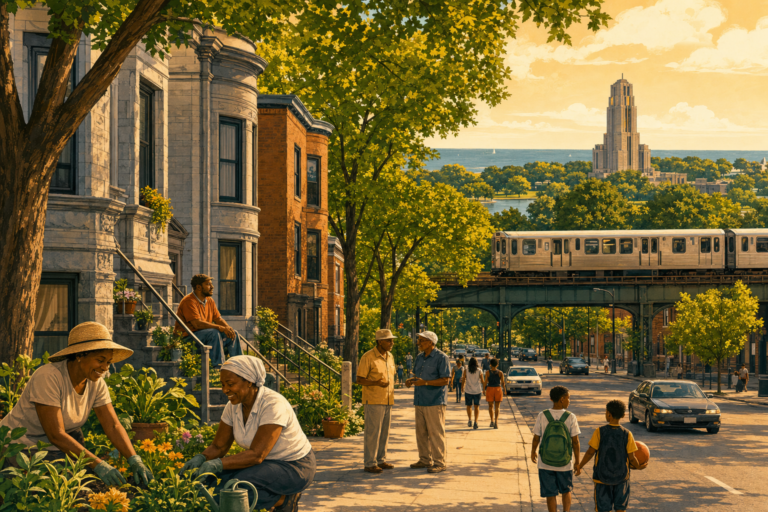
Illustration of a Woodlawn street of greystone two-flats with the Green Line along 63rd Street and Jackson Park trees with a stone tower in the distance

Woodlawn’s median house sold for $114,678 in 2019 and $347,500 in 2025, three times as much, on 35 and 39 sales. Its median two-to-six-flat, at $462,000, is above the citywide $445,000. And the South Side area has more two-to-six-flats on the tax rolls than it had in 2006: 1,740 against 1,695. Rebuilt September 30, 2026 on the county’s updated sales file.

West Englewood, by the Numbers: The Median House Went From $40,000 to $152,500, the Largest Rise Among 70 Community Areas

Illustration of a West Englewood street of brick and frame cottages and two-flats with front porches, neighbors outside, and a Green Line track in the distance

West Englewood’s median house sold for $40,000 in 2019 and $152,500 in 2025, the largest rise among the 70 Chicago community areas with enough sales to compare. Its median two-to-six-flat went from $63,000 to $220,000, also the largest rise. The Assessor valued the homes sold there in 2025 at 57 percent of their prices with every sale counted, the lowest of the 65 areas with a figure, and at 63 percent with recent resales set aside. Rebuilt September 30, 2026 on the county’s updated sales file.

New City, by the Numbers: Four of Five Market Signals Active, and First-Time Business Licenses Up From 80 to 214

Illustration of a Back of the Yards street with brick two-flats and new small storefronts opening along a lively commercial strip

New City, the South Side community area that includes Back of the Yards and Canaryville, is one of three areas where four of the five market signals in our analysis are active. First-time business licenses went from 80 in 2019 to 214 in 2025, and the median two-to-six-flat price doubled, from $115,000 to $230,000. Rebuilt September 30, 2026 on the county’s updated sales file.

Moving HereLiving HereCity in MotionNeighborhoods & Suburbs
About · Editorial Policy · Our Data & Methods · Privacy · Terms · Contact
© 2026 Keep Chicagoland Moving · A TAK Marketing, LLC publication · Part of the fabulous Omnishun information systems