

Chicago’s Deep Tunnel is not the city’s — it belongs to the Metropolitan Water Reclamation District, a separate agency — and the district posts its own records. Its daily pumping logs, summed here year by year, show 1,546,047 million gallons — about 1.55 trillion — pumped back out of the tunnels to the Stickney and Calumet treatment plants in the 28 years the logs carry in full — a row for every calendar day — between 1996 and 2025, with the record year, 2018, the first full year after the first stage of McCook Reservoir opened. Its status report puts the system’s cost at $3,856,000,000 in contract dollars: 110.4 miles of tunnel for $2.33 billion and three reservoirs for $1.52 billion. And its own documents record a date moving: the reservoir stage that completes the plan was “expected to be operational in 2029” in the district’s December 2024 report, “no later than 2032” in its June 2025 report, and “Dec. 31, 2032” in an August 2025 release that names the reason — a slowdown in demand for the quarried stone. Two things the logs are not: they are not capture at the sewers, and they are not complete — the posted files skip July 2019 through December 2020, and nothing here is filled in.
MWRD TARP return-flow workbooks (six files, 1988–March 2026) + TARP status reports (June 30, 2025; Dec. 31, 2024; Dec. 31, 2017) + TARP fact sheet (March 2025) + Aug. 15, 2025 release · retrieved August 21, 2026What the Deep Tunnel is, by the district’s documents
The district’s TARP status report as of June 30, 2025 describes the Tunnel and Reservoir Plan as the region’s 1972 choice for meeting water-quality standards across a combined-sewer area of about 360 square miles — Chicago and 51 suburbs — with three stated goals: keep raw sewage out of Lake Michigan, improve the rivers, and give floodwater somewhere to go to reduce street and basement backups. Phase I is four tunnel systems totaling 110.4 miles and 2,320 million gallons of storage, 8 to 33 feet in diameter: Mainstream (40.5 miles, 1,200 million gallons), Calumet (36.7 miles, 630), Des Plaines (26.6 miles, 420), and Upper Des Plaines near O’Hare (6.6 miles, 70). Construction began in 1975; the March 2025 fact sheet dates the first tunnel online to 1981 and the whole tunnel system to 2006. Phase II is three reservoirs totaling 15.15 billion gallons — Majewski (0.35, completed 1998), Thornton (4.8 for TARP water, operational at the end of 2015), and McCook (10.0, of which Stage 1’s 3.5 billion has been operating since the end of 2017) — for 17.5 billion gallons when complete, which the fact sheet puts at more than 4,666 gallons for each of 3.71 million people in the service area. The report states that Phase I “capture[s] and enable[s] treatment of about 85%” of the area’s combined-sewer-overflow pollution; the fact sheet states that overflow days fell “from an average of 100 days per year to 50” once the tunnels ran. Those are the district’s figures, reported as its own.
What the district’s own logs show: 1.55 trillion gallons pumped back
- 199621,60612,021
- 1997(Calumet’s lowest full year)29,1048,434
- 199834,37413,233
- 199927,17711,767
- 200027,21011,890
- 200148,42516,338
- 2002(Stickney’s second-highest)56,39611,166
- 200327,21915,015
- 200428,09515,619
- 2005(Stickney’s lowest full year)21,42512,947
- 200634,52224,309
- 200733,24819,132
- 200842,21524,254
- 200939,27624,479
- 201038,78923,860
- 201141,23324,669
- 201228,08412,818
- 201341,59719,701
- 201444,22522,694
- 201534,67216,977
- 201632,19823,165
- 2017(the Calumet record)36,61026,886
- 2018(the Stickney record; McCook Stage 1’s first full year)57,02426,038
- 202137,58422,477
- 202244,10116,832
- 202341,70417,571
- 202446,08121,268
- 202541,90914,384
The district posts, on its TARP data page, “detailed daily data on water pumped to water reclamation plants from TARP” — six workbooks, one sheet per year, one row per day, a flow column in million gallons per day: Stickney from 1989 and Calumet from 1988, each through March 2026. Summing a year’s daily values gives that year’s million gallons, and across the 28 years the files carry in full — every calendar day present as a row, 1996 through 2018 and 2021 through 2025 — the logs total 1,036,103 million gallons at Stickney and 509,944 at Calumet, 1,546,047 million together: about 1.55 trillion gallons, 67 percent of it through Stickney. The Stickney log peaks in 2018 at 57,024 million gallons, edging 2002’s 56,396; 2024’s 46,081 is the fourth-highest year, and 2025 closed at 41,909. Its lowest full years are 2005 (21,425) and 1996 (21,606). Calumet peaks in 2017 at 26,886 and 2018 at 26,038; its 2025 figure, 14,384, is its lowest since 2012. Across three periods the Stickney average runs 32,103 million gallons a year for 1996–2005 (ten years), 38,746 for 2006–2018 (thirteen), and 42,276 for 2021–2025 (five); Calumet’s runs 12,843, 22,229, and 18,506. Pumping is a year-round operation in the logs rather than a storm-day spike: across the full years the busiest calendar month, May, holds 10.6 percent of the water and January and February 6.3 percent each. The single largest daily value in the Stickney log is 655 million gallons on June 14, 2014. The year 2026 is posted only through its first quarter, which shows 14,269 million gallons at Stickney and 5,494 at Calumet. None of this is “capture”: the logs measure water pumped out of the tunnels to the plants, and the district’s own TARP page states separately that the system “has captured over 1 trillion gallons of combined sewage” since 1981 — a different measure over a different span, consistent with the logs and not reconciled to them here.
The hole in the posted record
The district’s 2011–2020 workbooks end on June 30, 2019, and its 2021–2030 workbooks begin on January 1, 2021: the eighteen months from July 2019 through December 2020 appear in neither file, at either plant. The first half of 2019 is posted (27,216 million gallons at Stickney, 18,114 at Calumet) and is kept out of the year table above. The early years are thinner still: the 1989 Stickney sheet carries a flow value on 179 of 365 days and leaves 186 blank, and the sheets for Calumet from 1988 and Stickney from 1989 through 1995 carry blanks the files do not explain — a blank is read here as no value recorded, never as zero, and those years are left out of every total. Even the 28 full years are not spotless: the Stickney sheets leave 19 days blank across them (one each in 1996 and 1997, fifteen in 2000, two in 2004) and carry two non-numeric cells in 1999, and the Calumet sheets carry 13 non-numeric cells (one each in 1996 and 2002, seven in 2004, four in 2015); every such day is excluded from its year’s sum, so those years read slightly low rather than guessed. Nothing in this page is interpolated across the hole or the blanks; the year table is the logs, summed, and only from the values the logs record.
What it cost, in the district’s contract dollars
- Mainstream tunnel system(40.5 miles)$1,142,000,000
- Calumet tunnel system(36.7 miles)$657,000,000
- Des Plaines tunnel system(26.6 miles)$469,000,000
- Upper Des Plaines tunnel system(6.6 miles, near O’Hare)$64,000,000
- McCook Reservoir(10.0 BG; $34 million remaining)$1,029,000,000
- Thornton Reservoir(4.8 BG)$450,000,000
- Majewski Reservoir(0.35 BG)$45,000,000
The status report’s own summary: Phase I tunnels and related facilities $2,332,000,000, all completed; Phase II reservoirs $1,524,000,000, of which $34,000,000 at McCook remained; Tunnel and Reservoir Plan total $3,856,000,000. The report’s footnote is the boundary: the figures “represent contract award costs and are not in today’s dollars,” and its Table I lists a further $5,800,596 of Phase I contracts excluded from the tunnel total “for various reasons.” The report as of December 31, 2017 printed a total of $3,811,000,000 — though its three reservoir lines then (Majewski $44,810,552, Thornton $418,000,000, McCook $1,030,000,000) sum to $1,492,810,552 against the $1,479,000,000 reservoir subtotal it printed, a discrepancy inside that document and left as found. Line by line, the 2025 figures differ from 2017’s by Thornton plus $32,000,000, McCook minus $1,000,000, and Majewski plus $189,448 in rounding to the nearest million. The reports’ benefit figures are the district’s estimates and are reported as such: more than $175 million a year from a completed McCook for 3.1 million people in 37 communities; 556,000 people in 14 communities served by Thornton.
The last reservoir stage, as the district has dated it
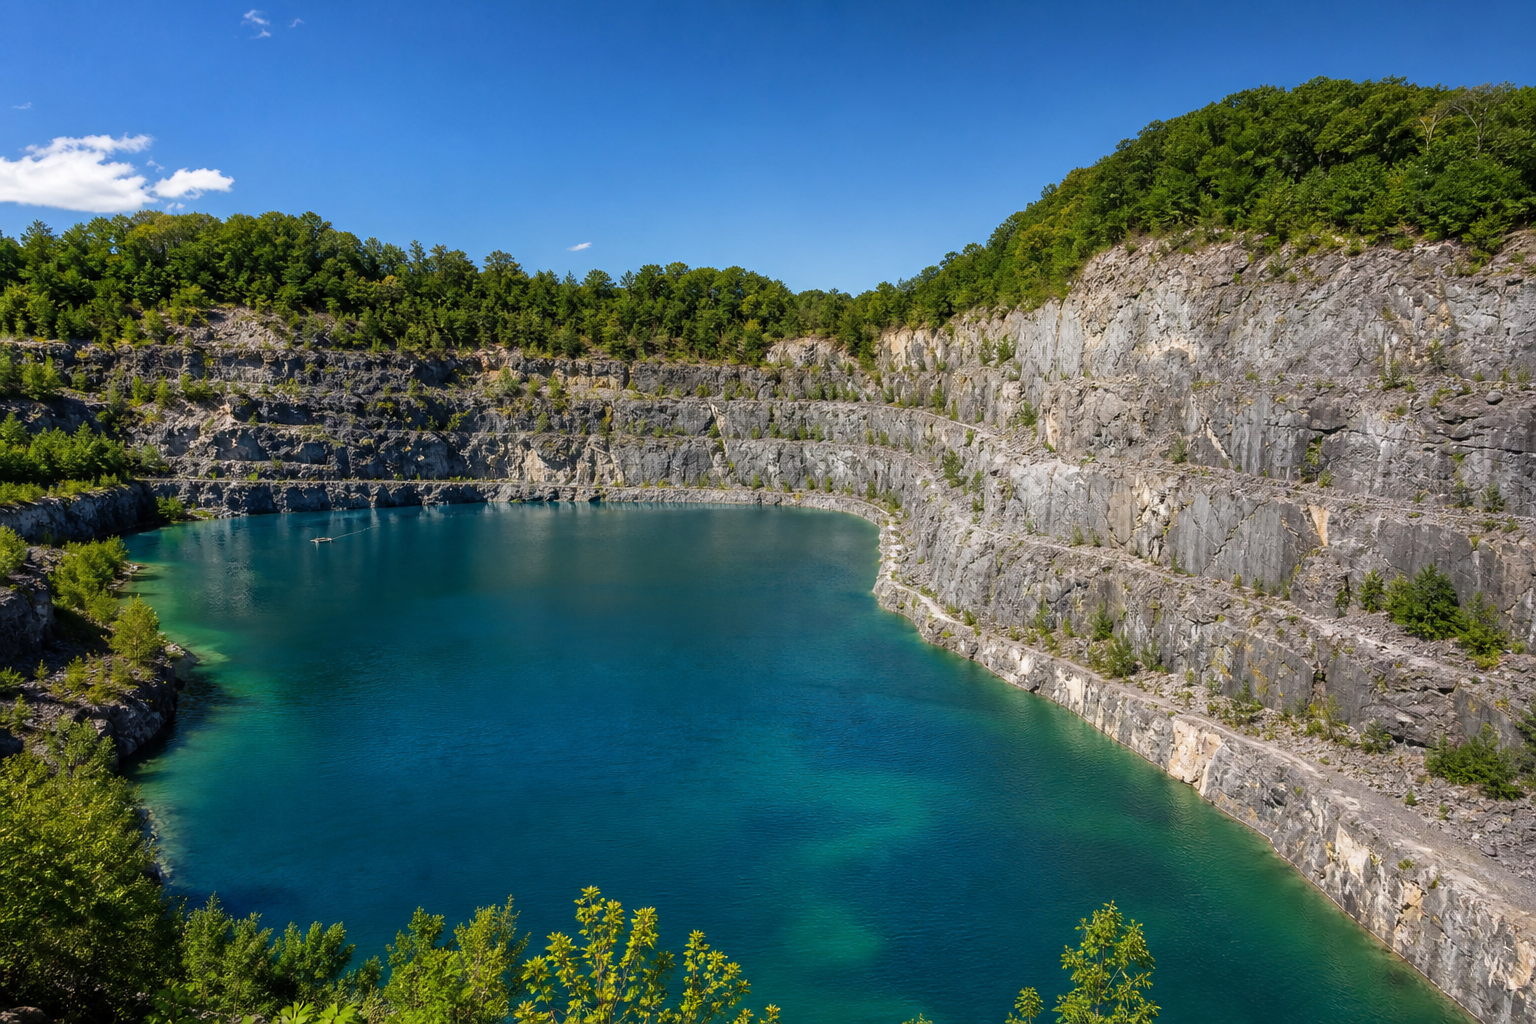
McCook Reservoir is the plan’s last piece, mined in two stages by a commercial quarry operator under a 2003 agreement, with full production mining having begun in March 2008 and expected, the reports say, to take about twenty years; the district expanded Stage 2 from a federally authorized 3.5 billion gallons to 6.5 billion in 2006. The report as of December 31, 2024 put Stage 2 at “approximately 66% excavated” and “expected to be operational in 2029,” and the March 2025 fact sheet lists “Phase 2 (Reservoirs) to be completed 2029.” The report as of June 30, 2025 put it at “approximately 72% excavated” and “expected to be operational no later than 2032, pending market conditions for the sale of mined rock.” The district’s August 15, 2025 release stated the schedule plainly: Stage 2 had been projected for completion by December 31, 2028 and operation by December 31, 2029; the new estimate for operation is “Dec. 31, 2032,” because “due to a slowdown in the demand for stone in the Chicago area, the mining will take longer than expected.” The same documents carry the district’s running tallies of what the reservoirs have taken in: Stage 1 of McCook “approximately 130 billion gallons” since the end of 2017 (126 billion in the December 2024 report); Thornton approximately 63 billion since the end of 2015 (62 billion six months earlier; 14 billion at the end of 2017); Majewski roughly 8 billion since 1998; and the temporary Thornton Transitional Reservoir, decommissioned in September 2022, more than 58 billion gallons of floodwater across 83 fill events. Those are the district’s capture statements, kept apart from the pumping ledger above.
What the district posts live
Beyond the annual reports, the district’s TARP pages carry a live map of reservoir levels at Thornton, McCook, and Majewski, and sign-ups for its overflow alerts and combined-sewer-overflow notifications — and its levels page states the limit in its own words: street flooding and basement backups “can still occur even when there is plenty of room in TARP,” because the small local sewers may not carry water to the tunnels, and if TARP is full the local sewers “are designed to overflow to waterways.” That is the district’s statement of what the system does and does not promise; the city’s 311 record of basement backups is a different file, read in our water-in-basement ledger, and the two are never blended here.
Known limits
The computed figures are sums of the district’s posted daily flow values, in the files’ own unit, over the years the files carry in full and only from the values recorded; they describe water pumped from TARP to two plants, not water captured, not overflows avoided, and not the third, smaller system at O’Hare, whose pumped flow is not in these files. What a day’s value measures at the plant is the district’s convention. The documents’ figures — miles, volumes, costs, dates, capture tallies, benefits — are quoted as each document states them, with the document’s date; the movement of the McCook date across three documents is reported, not explained beyond the district’s own stated reason. Costs are contract-award dollars by the report’s own note. This page takes no position on the plan’s merits.
- The logs MWRD TARP return-flow workbooks posted on the district’s TARP data and reports page: Stickney TARP 1989–2010, 2011–2020, 2021–2030 and Calumet TARP 1988–2010, 2011–2020, 2021–2030 (six files, 75 year-sheets — 37 for Stickney and 38 for Calumet, with no 2020 sheet at either plant — retrieved August 21, 2026; the 2021–2030 files run through March 31, 2026). Each sheet’s FLOW column, in million gallons per day, was summed by calendar year; a blank or non-numeric cell is treated as no value and excluded (19 blank days and 2 non-numeric cells at Stickney, 13 non-numeric cells at Calumet, within the 28 full years); years not present in full (1988–1995, 2019, 2026) and the files’ gap (July 1, 2019–December 31, 2020) are excluded from all totals and averages. Percentages are computed from raw sums.
- The documents MWRD TARP Status Report as of June 30, 2025, as of December 31, 2024, and as of December 31, 2017; the TARP fact sheet dated March 12, 2025; the August 15, 2025 news release; and the district’s TARP page. Figures from different documents are never summed, and document figures are never combined with the computed ledger.
Computed and compiled by KCM Desk from the Metropolitan Water Reclamation District’s posted files, retrieved August 21, 2026. Human-guided and edited — about this desk. If you spot an error, corrections come first.
Related Keep Chicagoland Moving coverage
- 7 Things Under Chicago, by the Record: Raised Streets, a Freight-Tunnel Flood — and Tunnels 300 Feet Down
- Chicago Reversed Its River in 1900. MWRD’s Own Log Shows It Has Released Water Back Into Lake Michigan 36 Times From 1985 Through 2025 — 52.5 Billion Gallons, the Last in July 2023, None in 2024 or 2025
- How Chicago Works, by the Numbers
- Chicago’s 69,852 Water-in-Basement 311 Requests Since 2018 Follow the Storms: One Day in August 2025 Holds 5 Percent of Them, and Twenty Days Hold a Third
- The Yellow Flag Flies 7 Times as Often at One Chicago Beach as at Another