Category City in Motion

The changes reshaping Chicagoland: transit projects, development, stadium moves, budgets, and what each one means for the people who live here.

The CTA’s Own Daily Ledger: 11.06 Billion Boardings Since 2001, a Two-Million-Ride Day in 2008 — and a Recovery the Bus Is Carrying

A CTA elevated train curving above a street as a bus passes below

The CTA's one-row-per-day boarding ledger, read whole: 11,061,239,838 boardings across 2001-2025, a 2,049,519-ride day on July 3, 2008, a 110,047-ride Sunday in May 2020, a 2012 peak year and a 2021 trough - and a recovery the bus is carrying, with the bus share of boardings up from 52.1 percent in 2019 to 59.9 percent so far in 2026. Boardings are rides, not people; the CTA is a separate agency; dates are printed without events attributed.


Chicago’s Rideshare Roster: 86,195 Driver Records in June 2026, Little More Than Half Its 2017 Peak — and a Third of Them Recorded Zero Trips

Parked sedans on a wet Chicago street at night

The companies must report their eligible drivers to the city monthly, and the register runs 12,014,008 driver-month rows since 2015. June 2026: 86,195 driver records - 6.5 per active chauffeur license, and little more than half the March 2017 peak of 154,619. A third recorded zero trips, 29.5 percent drive for more than one company, 57.9 percent started within a year, 40.9 percent list Chicago addresses, and every row reads Independent Contractor. The file has no name column.

Chicago’s Chauffeur Register Holds More Expired Licenses Than Active Ones — 13,758 to 13,274 — and Its Oldest Active License Record Was Issued in 1965

The empty driver's seat of a parked Chicago taxi at dusk

Behind every licensed Chicago cab is a second license: the person's. The Public Chauffeurs register holds 29,935 license records - 13,274 ACTIVE, 13,758 EXPIRED, 941 DENIED - with the oldest active record issued in 1965, 44 percent of active licenses minted since 2022, half of active records listing addresses outside Chicago, 149 active pedicab chauffeurs, and 161 horse-drawn rows the file still remembers. The name and sex columns were never selected.

In Chicago’s Big-Building Energy File, 769 Buildings Wear Four Stars and 564 Wear Zero — and 542 Didn’t File for 2023

Chicago high-rise windows lit unevenly at dusk

The city's energy-benchmarking file is a report card on 3,852 big buildings, one row per building per reporting year. In the 2023 vintage: 769 buildings wear the 4-star placard and 564 wear zero; 2,584 filed and 542 did not; the average K-12 school scores 25.3 points below the average office; one building records a perfect 100; and the filers sum to 637 million square feet and 4.59 million tons of reported greenhouse gas. The file's last portal update: February 5, 2025.

In June 2026, a Chicago Taxi Mile Cost $4.17 and a Rideshare Mile $4.21 — and the Fare Dollar Split Opposite Ways

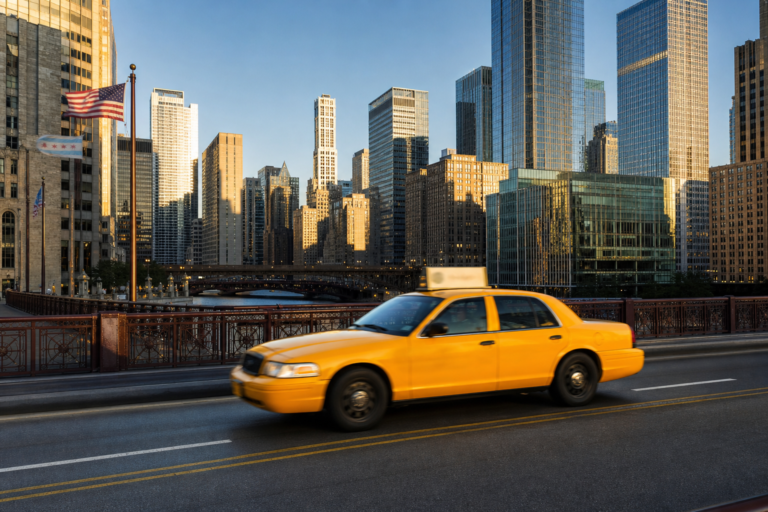
A Chicago taxi crossing a downtown river bridge in late-afternoon light

In June 2026 a mile in a Chicago taxi cost $4.17 and a mile in a rideshare $4.21 - 3.4 cents apart, computed from the city's own trip files by the identical formula. The money splits opposite ways: 81 cents of the taxi dollar is metered fare; 60 cents of the rideshare dollar is fare and almost 35 is the additional-charges line. Plus: the taxi mile is up 9.3 percent since 2024, two airport-area community areas supply a fifth of pickups, about 2,900 cabs are working, and cash tips all but never reach the file.

Chicago’s 2026 Budget Carries 27,924 Annual Positions. The Employee File Runs 1,546 Below It at the Police Department Alone — and the Top Budgeted Salary Belongs to the Aviation Commissioner.

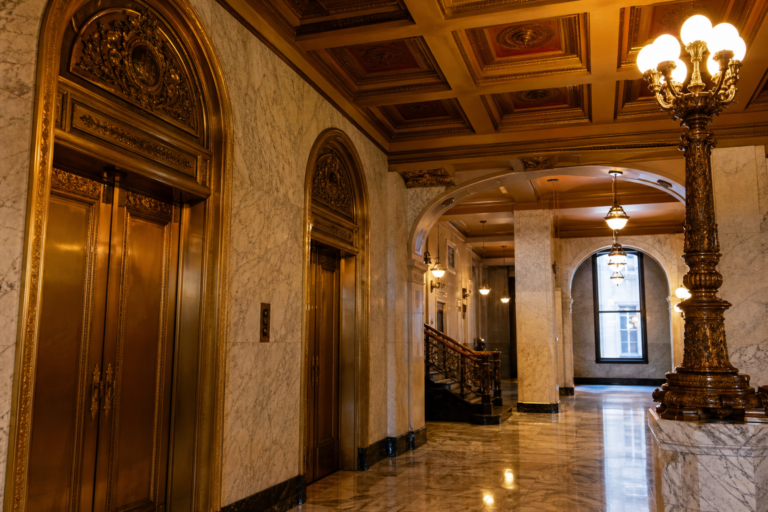
The marble lobby and brass elevator doors of a grand Chicago municipal building

The mayor's 2026 budget proposal carries 27,924 annual positions - plus 3.2 million budgeted hours and 794 budgeted months this page never adds to them. Beside the August employee file: police budgeted 13,727, on payroll 12,181. Police Officer is 31 percent of every budgeted position; the top budgeted salary is the Aviation Commissioner's $350,000, above the superintendent and the mayor.

Chicago’s Taxi Medallions, Sale by Recorded Sale: A $357,000 Median in 2013, $6,000 in 2026 — and the File’s Most Frequent Seller Is the City Itself

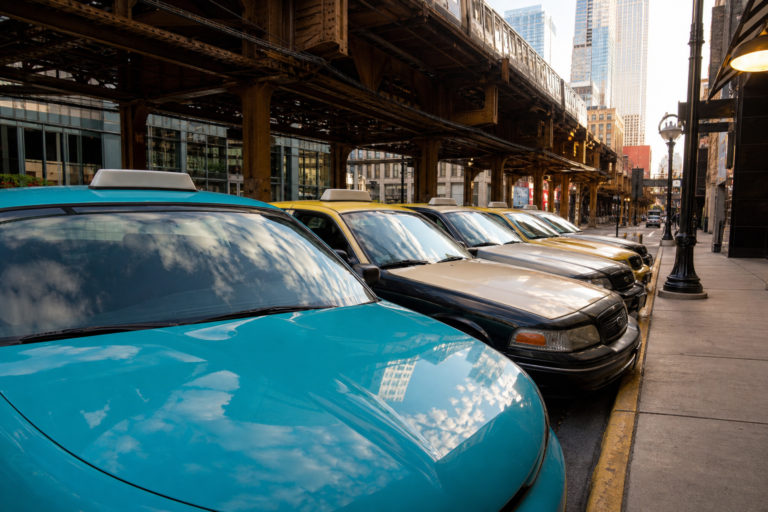
Parked Chicago taxis on a side street beneath elevated train tracks on an overcast day

The city records every taxi-medallion transfer it processes: 5,729 closings since 2007. The median recorded sale was $357,000 in 2013 and $6,000 in 2026 - a 98.3 percent collapse, with transfers nearly stopping (21 in 2015) before prices gave way. One medallion fell from $380,000 to $12,000; the file's most frequent seller is the city's own BACP. Prices from positive-price sales; 166 $0 transfers counted apart.

The Ten Chicago Community Areas With the Most City-Listed Affordable Rental Units: Grand Boulevard Leads With 2,406 of 29,550 — and Humboldt Park Has the Most Developments, 48

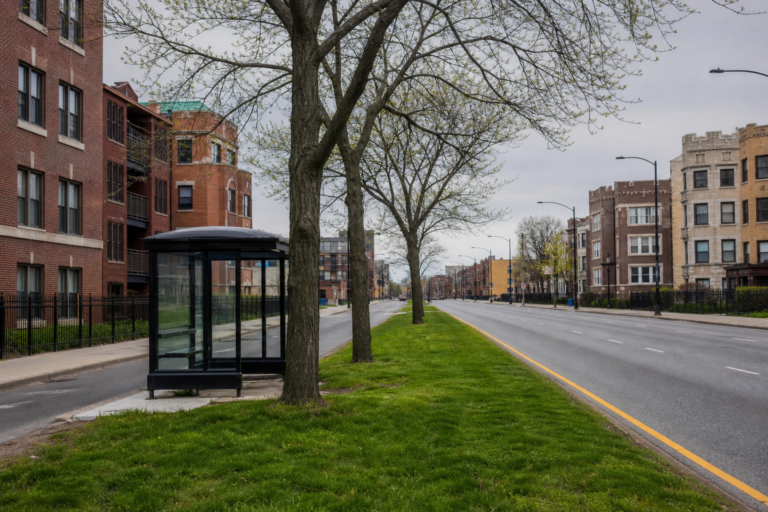
A Chicago boulevard with a grassy median lined by brick apartment buildings and greystones

Grand Boulevard holds 2,406 of the 29,550 units on the city's Affordable Rental Housing Developments list - 8.1 percent - and Humboldt Park has the most developments, 48. The ten community areas with the most city-listed units, with development counts beside them, from the city's list as updated December 30, 2024; listed units, not availability; eleven areas carry none.

Chicago’s Pensions, as the Documents State Them: $14.2 Billion Held Against $50.6 Billion of Pension Liability at the End of 2025, 28 Percent Funded — and No Fund Projected to Pass 50 Percent Before 2043 on the Schedule State Law Sets

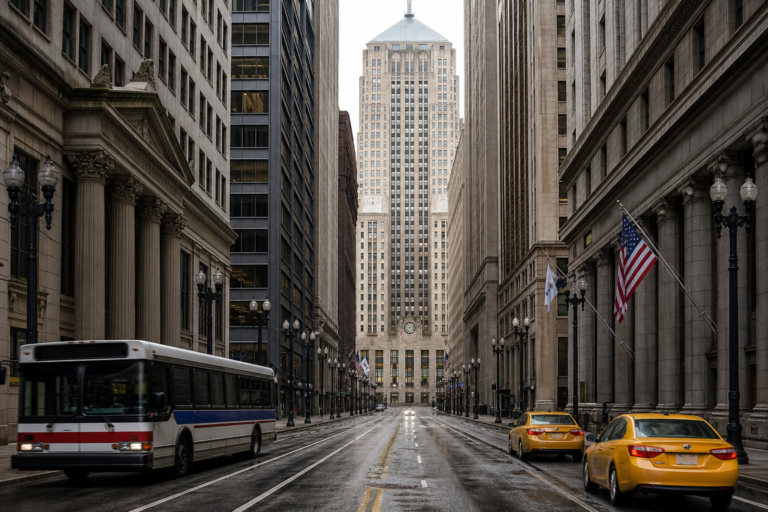
LaSalle Street in downtown Chicago looking south toward the Board of Trade on an overcast day

By the city's own 2025 financial report, Chicago's four pension funds held $14.20 billion against $50.63 billion of pension liability at the end of 2025 - 28.1 percent funded, up from 25.4. The funds' own actuaries project none passing 50 percent before 2043 on the statutory schedule, which they call back-loaded; the same day's press release states 28.15 percent on a different liability basis. Every figure from the city's report, the funds' valuations, the state's biennial report and the Council's analysts, page-checked.

Chicago’s Environmental Complaints, Inspections and Enforcement Files Each Split at January 1, 2012 — and the Older Half of the Complaints and Inspections Files Records No Outcomes at All

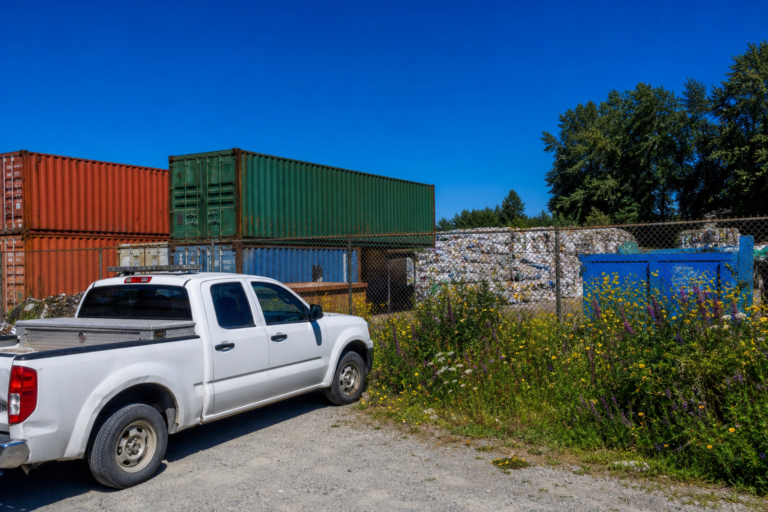
A city inspection truck beside a recycling yard on a sunny day

The city's three environmental files - 65,402 complaint rows, 282,616 inspection rows, 37,927 enforcement rows - each split at January 1, 2012 between the Department of Environment's system and the Department of Public Health's. The older half of the complaints and inspections files records no outcome on any row; the newer half records one on every row but leaves half its complaints undated; inspection dates run from 1753 to 4202; and the enforcement fine column repeats and goes negative, so no dollar total appears.

Moving HereLiving HereCity in MotionNeighborhoods & Suburbs
About · Editorial Policy · Our Data & Methods · Privacy · Terms · Contact
© 2026 Keep Chicagoland Moving · A TAK Marketing, LLC publication · Part of the fabulous Omnishun information systems