Category Neighborhoods & Suburbs

Profiles of Chicago-area suburbs, neighborhoods, and subdivisions, from village basics to individual communities. Built to answer the question every mover asks: what is it actually like to live there?

Woodlawn, by the Numbers: The Median House Price Tripled on 39 Sales, and the Tax Rolls Show More Two-to-Six-Flat Parcels Than in 2006

Illustration of a Woodlawn street of greystone two-flats with the Green Line along 63rd Street and Jackson Park trees with a stone tower in the distance

Woodlawn’s median house sold for $114,678 in 2019 and $347,500 in 2025, three times as much, on 35 and 39 sales. Its median two-to-six-flat, at $462,000, is above the citywide $445,000. And the South Side area has more two-to-six-flats on the tax rolls than it had in 2006: 1,740 against 1,695. Rebuilt September 30, 2026 on the county’s updated sales file.

West Englewood, by the Numbers: The Median House Went From $40,000 to $152,500, the Largest Rise Among 70 Community Areas

Illustration of a West Englewood street of brick and frame cottages and two-flats with front porches, neighbors outside, and a Green Line track in the distance

West Englewood’s median house sold for $40,000 in 2019 and $152,500 in 2025, the largest rise among the 70 Chicago community areas with enough sales to compare. Its median two-to-six-flat went from $63,000 to $220,000, also the largest rise. The Assessor valued the homes sold there in 2025 at 57 percent of their prices with every sale counted, the lowest of the 65 areas with a figure, and at 63 percent with recent resales set aside. Rebuilt September 30, 2026 on the county’s updated sales file.

New City, by the Numbers: Four of Five Market Signals Active, and First-Time Business Licenses Up From 80 to 214

Illustration of a Back of the Yards street with brick two-flats and new small storefronts opening along a lively commercial strip

New City, the South Side community area that includes Back of the Yards and Canaryville, is one of three areas where four of the five market signals in our analysis are active. First-time business licenses went from 80 in 2019 to 214 in 2025, and the median two-to-six-flat price doubled, from $115,000 to $230,000. Rebuilt September 30, 2026 on the county’s updated sales file.

Near West Side, by the Numbers: The Most New-Construction Permits of Any Area in the First Half of 2026, and the Smallest House-Price Rise of 70

Illustration of Chicago's West Loop and Fulton Market: brick warehouses, construction cranes, a Green Line train at a modern station, sidewalk diners

The Near West Side, directly west of the Loop, had 53 new-construction permits in the first half of 2026, the most of any Chicago community area, and none of the five market signals in our analysis is active there. Its median house price rose 16 percent from 2019 to 2025, the smallest rise among the 70 areas with enough sales to compare. Rebuilt September 30, 2026 on the county’s updated sales file.

East Garfield Park, by the Numbers: Four of Five Market Signals Active, and New-Construction Permits Up From 17 to 64

Illustration of a West Side Chicago street of brick two-flats with the Garfield Park Conservatory dome and a Green Line train in the distance

East Garfield Park, on Chicago’s West Side, is one of three community areas where four of the five market signals in our analysis are active. New-construction permits went from 17 in 2018–19 to 64 in 2024–25, and the median two-to-six-flat sold for $370,000 in 2025, up from $199,000 in 2019. Rebuilt September 30, 2026 on the county’s updated sales file.

Where Chicago’s Gentrification Signals Are Active: East Garfield Park, New City and North Lawndale Show Four of Five. Logan Square, Avondale and the Lower West Side Show None.

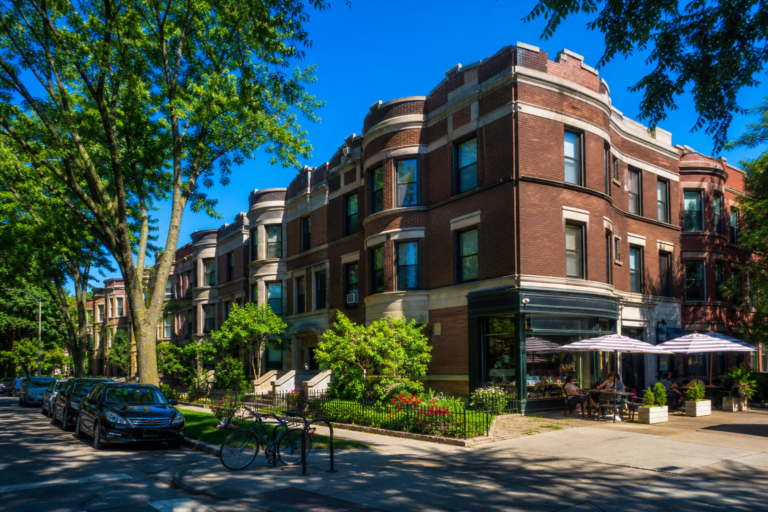
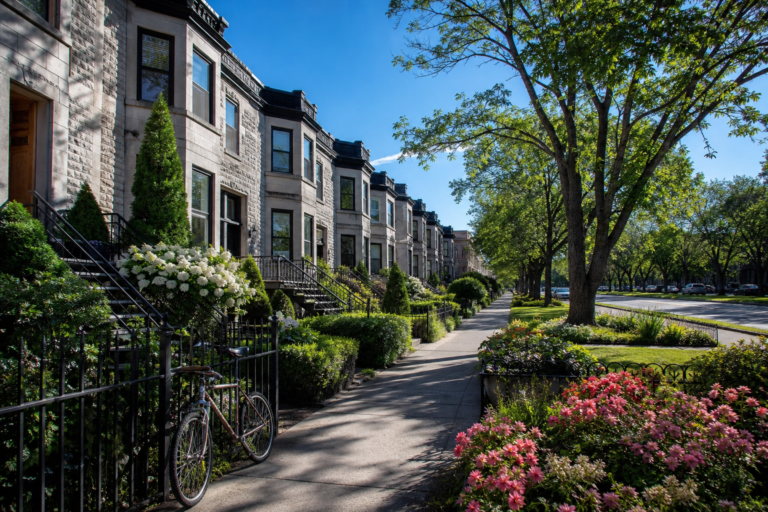
A block of Chicago greystone apartment buildings, one under renovation beside weathered neighbors

Five market signals scored from public records in all 77 Chicago community areas: house prices, two-to-six-flat prices, company buyers, new-construction permits and new business licenses. Three areas west and south of downtown show four of five; Logan Square, Avondale and the Lower West Side show none. Recomputed September 30, 2026, on the county’s updated sales file, with a correction to the company-buyer share.

Moving HereLiving HereCity in MotionNeighborhoods & Suburbs
About · Editorial Policy · Our Data & Methods · Privacy · Terms · Contact
© 2026 Keep Chicagoland Moving · A TAK Marketing, LLC publication · Part of the fabulous Omnishun information systems