
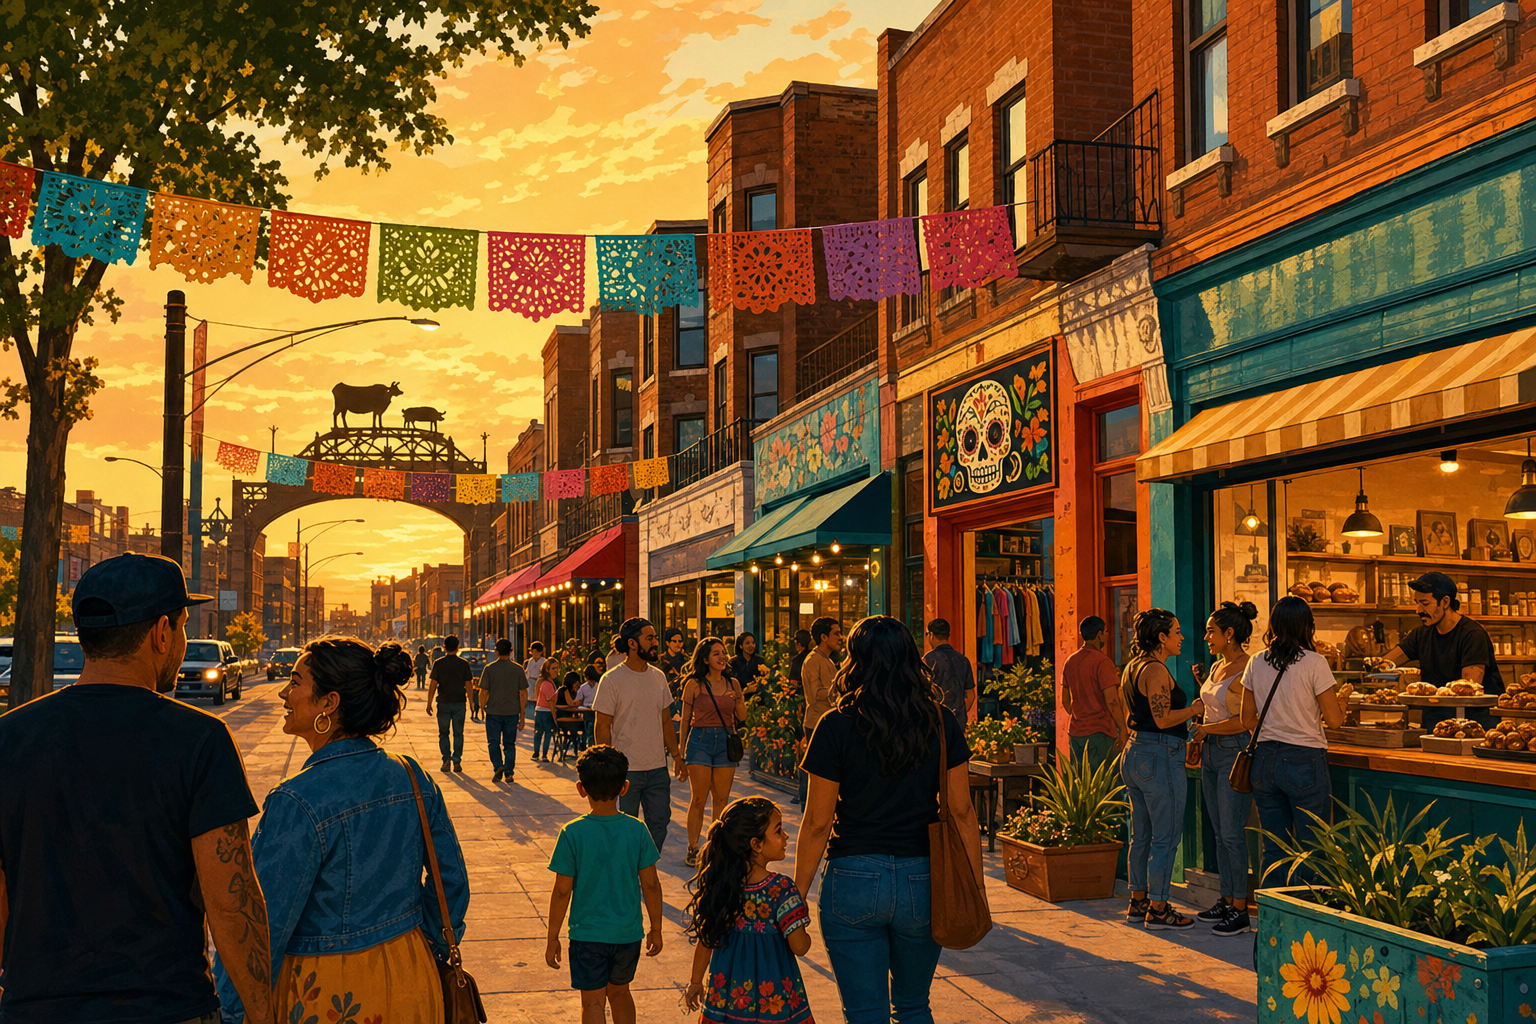

New City, the South Side community area that includes Back of the Yards and Canaryville, is one of three areas where four of the five market signals in our analysis are active. First-time business licenses went from 80 in 2019 to 214 in 2025, and the median two-to-six-flat price doubled, from $115,000 to $230,000.
Drawn from our analyses of county and city records · sales file as updated September 15, 2026 · assembled October 1, 2026Second reading and correction, September 30, 2026: this page was first published August 2, 2026. Its headline said New City was one of two areas with four of five market signals. On the recomputed signals there are three such areas, and North Lawndale is the third. On the county’s sales file as updated September 15, 2026, the 2025 median house price is unchanged at $210,000 and now rests on 111 sales, up from 84; the 2025 median two-to-six-flat price, printed as $237,000 on 100 sales, is $230,000 on 127; the company share of purchases, printed as 11.0 percent for 2018–19 and 16.2 percent for 2024–25, is 10.6 and 16.6 percent with trustees of land trusts counted as trusts.
- Median house sale, 2025$115,500 in 2019. 111 sales in 2025.$210K
- Median two-to-six-flat sale, 2025$115,000 in 2019. 127 sales in 2025.$230K
- Market signals activeOf five.4 of 5
- Homes bought by companies, 2024–2510.6 percent in 2018–19.16.6%
- Bought 2018–22 and resold within two years114 of 1,376 purchases.8.3%
- Assessor valuation as a share of sale price238 sales in 2025. 74 percent with resales set aside.70%
- Two-to-six-flats on the tax rolls, 20264,142 in 2006.3,848
What homes sold for
The county recorded sales of 111 houses and 127 two-to-six-flats in New City in 2025. The median house sold for $115,500 in 2019 and $210,000 in 2025, up 82 percent, 13th among the 70 community areas with 20 or more house sales in both years. Citywide the median house went from $230,000 to $320,000, up 39 percent. The median two-to-six-flat went from $115,000 to $230,000, up 100 percent, 12th among the 46 community areas with 20 or more two-to-six-flat sales in both years; citywide the rise was 62 percent. Too few condominiums sold in one of the two years for a median.
Every area and year, and the rules for which sales are counted: What a Chicago Home Actually Sold For: 245,849 Deeds Since 2018, All 77 Community Areas
Four of the five market signals are active
Our gentrification-signals analysis checks five records in every community area for unusually fast change between 2018–19 and 2024–25: house prices, two-to-six-flat prices, the share of homes bought by companies, new-construction permits and new business licenses. In New City, four of the five are active. Of the 67 areas scored, three show four signals and 40 show none. A signal is a measurement of change between two periods. It does not describe the people who live in an area or say what happens next.
- House pricesThe median house price was 1.82 times its 2019 level in 2025. The bar is 1.60 times, from a 2019 median below the citywide $230,000.yes
- Two-to-six-flat pricesThe median two-to-six-flat price was 2.00 times its 2019 level in 2025. The bar is 1.78 times.yes
- Company buyersCompanies bought 10.6 percent of homes sold in 2018–19 and 16.6 percent in 2024–25, up 6.0 points. The bar is a rise of five points.yes
- New-construction permitsPermits numbered 44 in 2018–19 and 59 in 2024–25. The bar is 1.5 times the earlier count, with at least eight in the later period.no
- New business licensesFirst-time licenses numbered 80 in 2019 and 214 in 2025, up 168 percent. The bar is 15 percent growth, with at least 30 in 2025.yes
The missing signal here is permits: 44 in 2018–19 and 59 in 2024–25, short of the 1.5 times needed. The license count is the unusual line. It rose 168 percent while the citywide count fell 13 percent. What kind of licenses? Read by type on August 2, 2026, the general Limited Business License went from 27 to 126, and Pop-Up Retail licenses from one to 27. Our reading: most of the rise is in general and temporary licenses, which count licenses issued and say little about storefronts opened.
Every area scored, with the thresholds: Where Chicago’s Gentrification Signals Are Active: East Garfield Park, New City and North Lawndale Show Four of Five. Logan Square, Avondale and the Lower West Side Show None.
Who bought
Companies bought 16.6 percent of the 441 homes sold in New City in 2024 and 2025, and 10.6 percent of those sold in 2018 and 2019. Citywide the share was 14.2 percent in the later period. A buyer counts as a company when its name on the deed carries a marker such as LLC, Inc. or Corp.; trustees of land trusts are counted as trusts. Of the 1,376 homes bought here from 2018 through 2022, 114 were sold again by their buyer within two years, 8.3 percent. The citywide rate is 7.1 percent.
The buyer names on the deeds, and the resales, are counted here: Who Is Buying Chicago? The Buyer’s Name on 245,849 Deeds: Companies Bought 13 Percent of Homes and 46 Percent of Those Resold Within Two Years
Two-to-six-flats since 2006
The Assessor’s rolls counted 4,142 two-to-six-flat parcels in New City in 2006 and 3,848 in 2026. Over the twenty years 422 left the class, and the largest group of those, 273, are now classed as vacant land. Another 128 parcels joined the class. Citywide the count fell from 127,818 to 119,943.
Every flat parcel of 2006, followed to 2026: Chicago’s Tax Rolls Show 7,875 Fewer Two-to-Six-Flats Than in 2006. Of the 13,049 Parcels That Left the Count, 6,208 Are Now Classed as Single-Family Houses.
Valuations, appeals and mortgages
The Assessor valued the 238 houses and two-to-six-flats sold in New City in 2025 at 70 percent of their sale prices, at the median. Citywide the figure is 81 percent. Of those sales, 36 were of a home that had sold within the two years before. With those set aside the figure is 74 percent, against 83 percent citywide. Owners of 10.0 of every 100 houses appealed their assessment to the Board of Review for tax year 2025, counting each house once, against 17.5 citywide, and 46 percent of those appeals won.
Valuations against sale prices, area by area: Chicago Houses and Two-to-Six-Flats Sold in 2025 Were Valued at 81 Percent of Their Sale Prices. Those Resold Within Two Years, at 60 Percent.
Appeals per 100 houses, mapped: Nearly Half of Lincoln Park’s Houses Appealed Their Property Tax Assessments. On the Southeast Side, About One in 24 Did.
Federal mortgage records show 170 home-purchase loans in New City in 2025, and the county file shows 238 sales. The two are separate systems with different coverage and do not match sale for sale. Of the sales, 37 were for $100,000 or less, and lenders made two purchase loans that size. The records do not say how the other sales were paid for. Of the loans, 24 were marked as not for the borrower’s own occupancy.
The lending records and their limits: At Least 1,532 Chicago Homes Sold for $100,000 or Less in 2025. Lenders Wrote 289 Mortgages That Size.
Permits and licenses
The city issued 30 new-construction permits in New City in the first half of 2025 and 12 in the first half of 2026. Citywide the counts were 666 and 698. Counted two years at a time, the area had 44 in 2018–19 and 59 in 2024–25. A permit is an approval to build and is not a finished building.
Every permit of the half-year, by area: Chicago Issued 698 New-Construction Permits in the First Half of 2026. Here’s Where They Went.
First-time business licenses numbered 80 in 2019 and 214 in 2025. Citywide they fell from 7,464 to 6,503. The file counts licenses issued and does not show whether a business opened or stayed open.
The citywide count: Chicago Licenses 1,000 Fewer New Businesses a Year Than Before the Pandemic. The Gap Is Downtown.
City services
For requests to 311 created from January 1, 2024 through June 15, 2026, the median time to close in New City was: graffiti removal, 0.8 days on 5,662 requests, against 0.7 days citywide; potholes, 5.8 days on 1,445 requests, against 5.8 days citywide; streetlight outages, 2.7 days on 1,922 requests, against 2.5 days citywide; abandoned vehicles, 8.1 days on 3,222 requests, against 11.6 days citywide; rodent complaints, 3.8 days on 2,362 requests, against 3.1 days citywide. A closed request is the city’s record that it closed the request. It does not confirm the repair.
Every request type and area, with the method: A Chicago 311 Garbage-Cart Request Took a Median 15.9 Days to Close, a Pothole 5.8 and a Traffic-Signal-Out Report 3 Hours: 883,837 Requests Timed by Community Area
Affordable-rental inventory and the L
The city’s affordable-rental inventory lists four developments with 336 units in New City, 29th by units among the 66 community areas on the list. The inventory is the city’s own list of developments its programs support. It was last updated December 30, 2024 and is partial by its own description.
Our count of that inventory is in a piece that also covers the state law barring rent control: New York City’s Rent Board Set 2026-27 Stabilized Increases at Zero. Illinois Law Bars Chicago From Controlling Private Rents.
No L station lies inside New City’s boundary.
Every station against its own 2019 count: Only Two L Stations Are Busier Than Before the Pandemic. Neither Is Downtown.
How this page is built
Every figure on this page is read from the published output of the analysis linked beside it, as those stood on October 1, 2026. Nothing here is measured separately, and each linked analysis states its own sources, periods and limits. The sale prices and buyer shares come from the county’s sales file as updated September 15, 2026. The county is still adding sales dated 2025, and those figures get another reading in January 2027. This page reports what the records show and takes no position on where anyone ought to live.
Assembled by KCM Desk from the analyses linked above. First published August 2, 2026; rebuilt October 1, 2026. Human-guided and edited — about this desk. If you spot an error, corrections come first.
Related Keep Chicagoland Moving coverage
- Chicago Housing, by the Numbers
- East Garfield Park, by the Numbers
- West Englewood, by the Numbers
- Englewood, by the Numbers
- Woodlawn, by the Numbers
- Avondale, by the Numbers
- Near West Side, by the Numbers
- Pullman, by the Numbers
- Logan Square, by the Numbers
- Lower West Side, by the Numbers
- North Lawndale, by the Numbers
- Roseland, by the Numbers
- Auburn Gresham, by the Numbers
- South Shore, by the Numbers
- Austin, by the Numbers
- Humboldt Park, by the Numbers
- Greater Grand Crossing, by the Numbers
- Chatham, by the Numbers
- West Pullman, by the Numbers
- Hegewisch, by the Numbers
- North Center, by the Numbers
- Lincoln Park, by the Numbers
- Lake View, by the Numbers
- West Town, by the Numbers
- South Chicago, by the Numbers
- Near North Side, by the Numbers
- Edgewater, by the Numbers
- Uptown, by the Numbers
- Rogers Park, by the Numbers
- Hyde Park, by the Numbers
- Irving Park, by the Numbers
- Bridgeport, by the Numbers
- Grand Boulevard, by the Numbers
- Douglas, by the Numbers
- South Lawndale, by the Numbers
- Armour Square, by the Numbers
- Lincoln Square, by the Numbers
- Portage Park, by the Numbers
- Belmont Cragin, by the Numbers
- Washington Park, by the Numbers
- Calumet Heights, by the Numbers
- Avalon Park, by the Numbers
- Kenwood, by the Numbers
- Where Chicago’s Gentrification Signals Are Active: East Garfield Park, New City and North Lawndale Show Four of Five. Logan Square, Avondale and the Lower West Side Show None.