
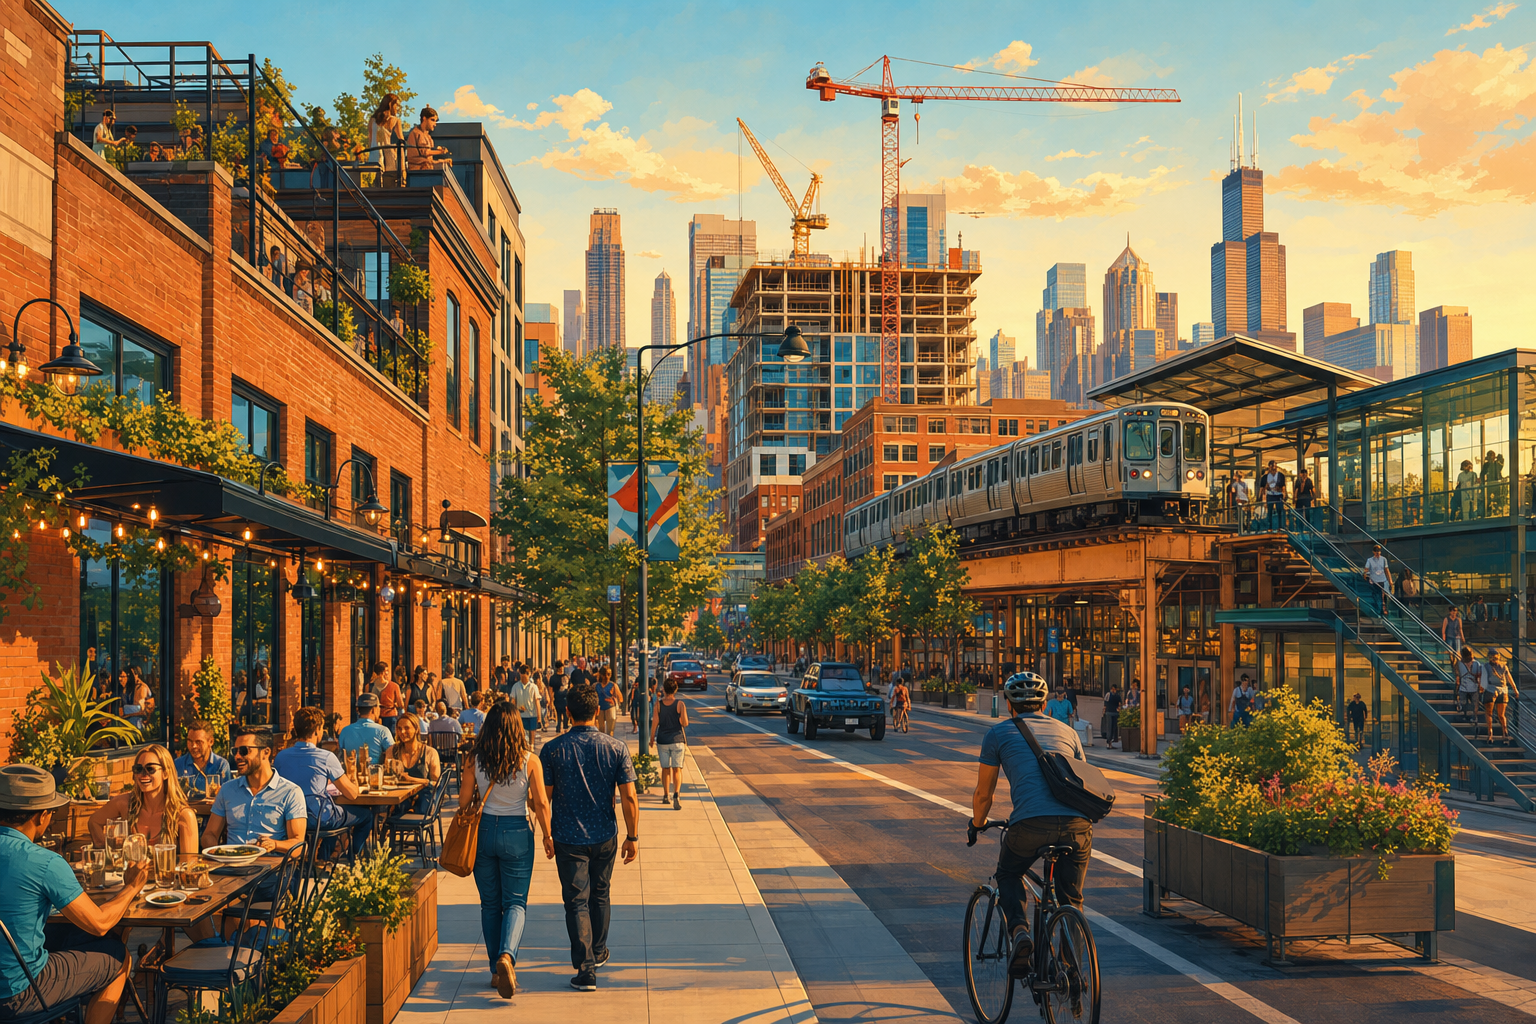

The Near West Side — the community area that contains the West Loop and Fulton Market, along with Greektown, Little Italy, the Illinois Medical District and the University of Illinois Chicago — got more new-construction permits in the first half of 2026 than any of Chicago’s 77 community areas. Its Morgan station is one of only two L stops busier than before the pandemic among the stations our ridership analysis could fairly compare (it set aside twelve whose numbers reflect construction closures). And yet the area trips none of the five indicators in our gentrification-signals analysis. That is not a contradiction: the signals measure change from 2019 to 2025 and look for acceleration from a below-citywide starting price — and this area entered that window already one of the city’s most expensive, with sale prices that have since risen more slowly than the city’s. This page gathers what our analyses have measured about the area, each figure linked to the analysis that computed it. What the numbers mean for the people living there is not a question data can settle, and this page does not try.
Every figure comes from the source files of our earlier analyses · assembled August 1, 2026What homes sell for
This is condo country: our deed screen recorded 303 condo sales in the area in 2025 against 48 house sales and 35 sales of two-to-six-flats. The condo median went from $315,000 in 2019 to $355,000 in 2025 — while the number of condo sales fell from 535 to 303, a decline in volume the whole city shared. The house median went from $538,250 to $615,000 (14 percent higher, on modest counts: 84 house sales in 2019, 48 in 2025). For scale: citywide, the house median rose 39 percent over the same years. This area’s prices did not fall behind the city’s levels — they started far above them and grew more slowly.
The screens behind these medians — only arm’s-length deeds, meaning ordinary sales between unrelated parties, mapped to community areas: What a Chicago Home Actually Sold For: 241,653 Deeds, All 77 Community Areas, 2018–2026
Why no gentrification signal is flashing
Our five-indicator screen looks for the market pattern of a neighborhood in transition: house prices accelerating from a below-citywide base, two-to-six-flat prices repricing faster than the city, corporate buyers taking a bigger share, permits multiplying, new business licenses multiplying. The Near West Side trips none of the five — and the first one it could never have tripped: that signal only fires in areas whose 2019 house median sat below the citywide median, and this area’s sat far above it. The other four measured real movement that stayed below the screen’s thresholds: flat prices rose 6 percent against a citywide 62 percent, the corporate share of purchases moved from 5.0 to 8.4 percent — a rise of 3.4 points, short of the five the screen requires — new business licenses fell, and permits in the screen’s own two windows fell as well, from 289 across 2018–19 to 164 across 2024–25; this year’s surge came after that window closed, as the building section below lays out. A signal here is a measurement of 2019-to-2025 change, not a verdict on a neighborhood — and over these years, by these measures, this was an already-expensive area growing more slowly than the city.
The full method, every area scored: Where Chicago’s Gentrification Signals Are Flashing: Five Market Indicators, All 77 Community Areas
What gets built — and what closes
The city issued 31 new-construction permits in the area in the first half of 2025 and 53 in the first half of 2026 — the most of any community area, ahead of the Loop. Zoom out and the picture is less one-directional: our signals analysis, which combines two years at a time, counted 289 permits across 2018–19 and 164 across 2024–25 — this year’s surge follows a slower stretch, and both windows are in the linked analyses. On the storefront side the area runs cooler: new business licenses fell from 449 in 2019 to 351 in 2025, part of the downtown-centered licensing decline our citywide count found. And of the 172 addresses here where an inspector found a restaurant gone since 2019 — only three community areas had more — 47 percent saw a new food business within two years. That is below the citywide 56 percent — a gap the linked analysis’s statistical check finds too large to be explained by chance alone, under that analysis’s method.
The full permit analysis — every area’s count, and where the money went — is here: Chicago Issued 698 New-Construction Permits in the First Half of 2026. Here’s Where They Went.
The citywide licensing decline behind that figure is measured here: Chicago Licenses 1,000 Fewer New Businesses a Year Than Before the Pandemic. The Gap Is Downtown.
The refill screen, its successor rule, and every area’s rate: After a Chicago Restaurant Is Found Out of Business, a New Food Business Shows Up in Inspection Records at 56 Percent of Addresses Within Two Years
What the mortgage records show
Federal mortgage records show 779 home-purchase loans in the area in 2025, 70 of them flagged in the records as not for owner occupancy. That loan count is larger than the 386 sales in our deed screen — not an error, but two systems counting different things: the deed screen keeps only arm’s-length sales of houses, condos and two-to-six-flats on single parcels, while the mortgage records cover lending across a wider set of homes. Dividing one by the other would not produce a meaningful loans-per-sale rate, here or anywhere.
The lending records and their limits: 1,424 Chicago Homes Sold for Under $100,000 Last Year. Lenders Wrote 289 Mortgages That Size.
City services, on the clock
From our timing of 793,774 closed 311 requests — created January 2024 through June 2026 — graffiti requests in the Near West Side typically closed the same day they were filed: a median of 0.0 days across 10,856 requests, against 0.7 citywide. Pothole requests took 5.9 days at the median against 5.1 citywide; streetlight-outage requests 2.6 days against 2.5; abandoned-vehicle requests 11.3 days against 11.6. On these clocks the area runs close to the citywide pace. A closed request is the record’s word, not a verified repair.
Every type, every area, with the method: Chicago on the Clock: We Timed 793,774 Service Requests, Neighborhood by Neighborhood
The affordable-rental inventory and the stop that beat 2019
The city’s affordable-rental inventory lists 35 developments and 1,958 units in the Near West Side — the second-most listed units of the 77 community areas. The inventory is a courtesy list, last updated December 30, 2024, and partial by its own description. On the L, Morgan — the Green and Pink Line stop in Fulton Market — averaged 3,424 weekday entries in January–May 2019 and 3,634 in the same window of 2026: 6 percent above its pre-pandemic traffic, one of only two stations above 2019 in that analysis’s comparison (Cermak-Chinatown is the other). The area’s other stations sit below their 2019 levels or — on the Blue Line’s Forest Park branch — were excluded from the comparison because construction closures, not demand, moved their numbers.
Our count of that inventory — its boundaries, and the state law that takes rent control off the table in Chicago: New York City’s Rent Board Set 2026-27 Stabilized Increases at Zero. Illinois Law Bars Chicago From Controlling Private Rents.
Every station against its 2019 self, and the construction exclusions: Only Two L Stations Are Busier Than Before the Pandemic. Neither Is Downtown.
How this profile works
No new data was fetched for this page: every figure is read from the source files of the analyses linked above, each of which documents its own methods, windows and caveats. Small bases are flagged where they occur, and where two analyses measure the same thing over different windows — as with permits — both windows are named. A standing rule for neighborhood pages: we report what the records show and take no position on where anyone should live — the records cannot answer that, and we do not pretend they can. Human-guided and edited — about this desk. If you spot an error, corrections come first.
Related Keep Chicagoland Moving coverage
- Chicago Housing, by the Numbers
- East Garfield Park, by the Numbers
- New City, by the Numbers
- West Englewood, by the Numbers
- Woodlawn, by the Numbers
- Avondale, by the Numbers
- Pullman, by the Numbers
- Englewood, by the Numbers
- Where Chicago’s Gentrification Signals Are Flashing: Five Market Indicators, All 77 Community Areas
- Chicago Transit, by the Numbers