
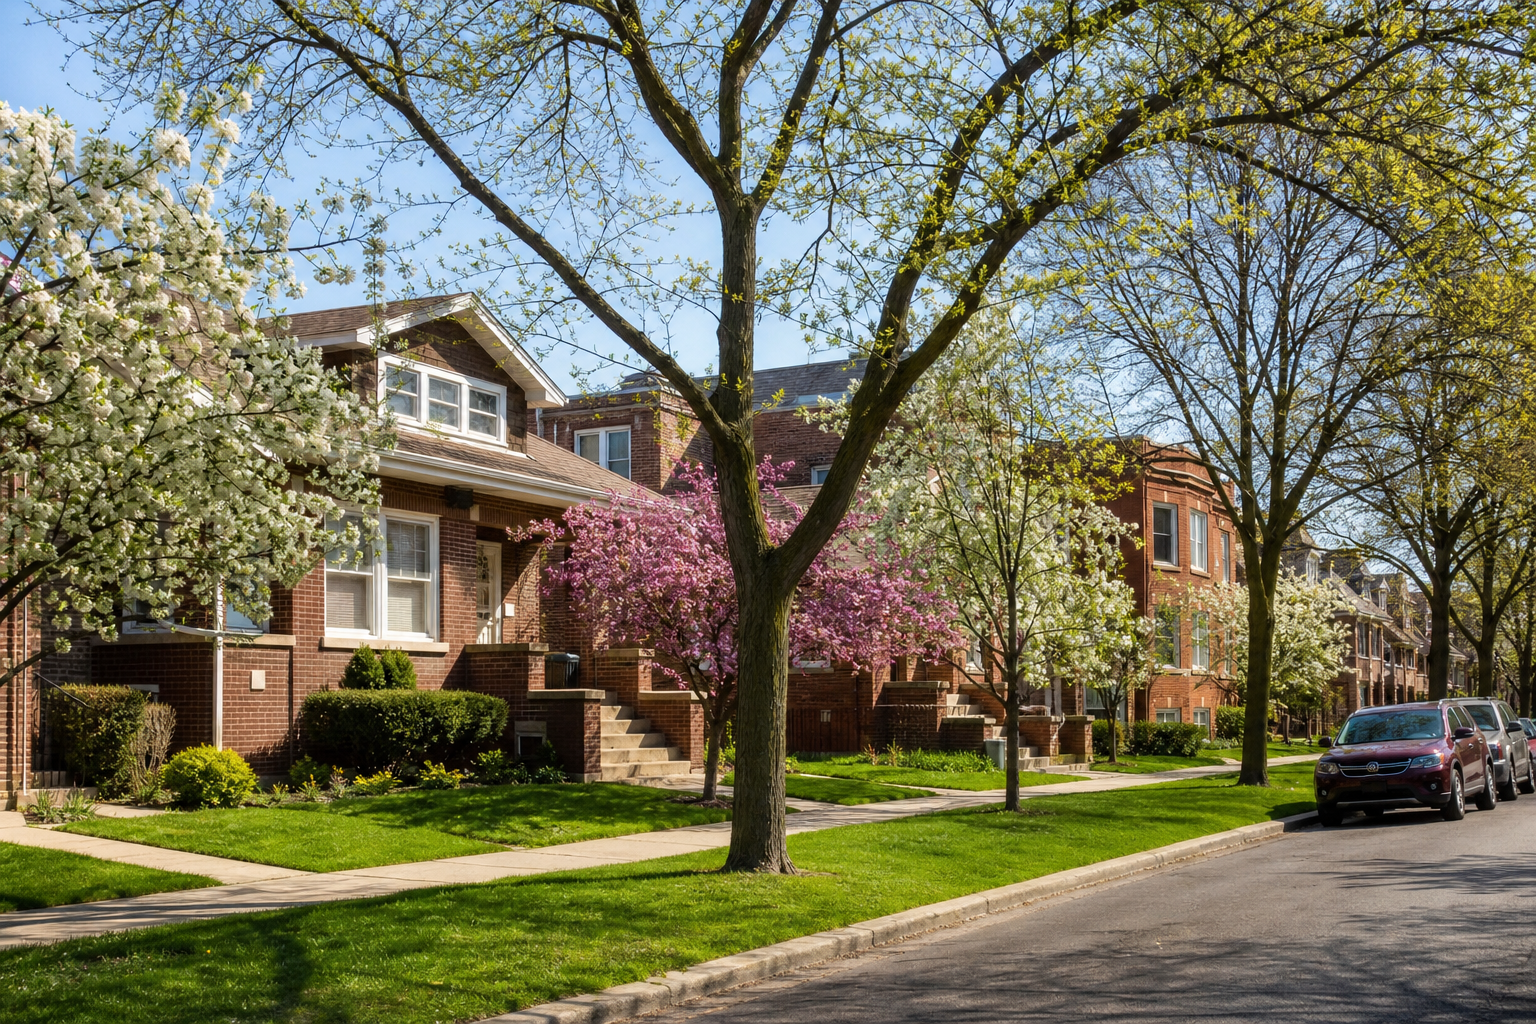

From 2018 through 2024, a Chicago house whose sale closed in June sold for a median 3.9 percent above the median for houses in its own community area that year, and one that closed in January for 7.5 percent below it: a 12.3 percent gap, about $38,000 on the 2024 citywide median house of $309,000, and at least 9 percent in every one of the seven years. Condominium closings in May ran more than twice January’s, 11.2 percent of a year’s condominium sales against 5.2 percent. The calendar is strongest in Hyde Park, the Loop, Lincoln Park, Lake View and the other condominium-heavy areas, where spring closings ran about twice winter’s, and nearly absent in West Englewood, Englewood, Greater Grand Crossing and North Lawndale, where they ran about even.
Cook County Assessor parcel sales (wvhk-k5uv), arms-length single-parcel sales, read September 30, 2026 · 211,180 sales, 2018 through 2024, the years the file has finished filling in · the month is the deed’s · the price comparisons and area matching are oursWhen do Chicago homes sell?
In late spring and early summer. June carried 9.9 percent of a year’s house closings and January 6.3 percent. Condominiums peak earlier and higher, in May at 11.2 percent, against 5.2 in January. Two-to-six-flats move least: 9.1 percent of a year’s sales in July, 6.8 in February. The month here is the one on the deed, the day the sale closed; the offer that led to it came earlier.
Do homes that close in June really sell for more?
Houses do, even against their own area. Set each sale against the median for the same kind of home in the same community area and year, and June’s houses sold for a median 3.9 percent above that mark and January’s 7.5 percent below, a gap of 12.3 percent. Without that control the June-over-January gap for houses is 25.8 percent; about half of it comes from which areas sell when, because more homes in high-priced areas close in summer. For condominiums the controlled gap is 7.8 percent, and for two-to-six-flats 7.6 percent. Our reading: part of June’s premium is more buyers in the market, and part is that the homes sold in spring are not the homes sold in winter; this file can separate the second only by area.
| Closing month | Houses | Condominiums | Two-to-six-flats |
|---|---|---|---|
| January | −7.5% | −4.4% | −5.8% |
| February | −7.4% | −1.7% | −4.4% |
| March | −2.7% | −1.7% | −2.7% |
| April | +1.2% | +3.1% | +0.4% |
| May | +2.8% | +0.6% | −0.5% |
| June | +3.9% | +3.0% | +1.4% |
| July | +2.3% | +2.3% | +0.7% |
| August | +1.5% | −0.3% | 0.0% |
| September | +1.2% | −0.4% | +2.4% |
| October | −0.7% | +0.5% | +0.3% |
| November | −0.1% | −2.3% | +0.4% |
| December | −0.7% | −4.5% | +2.5% |
Did the gap hold every year?
For houses, yes: it ran from 9.0 percent in 2022 to 17.9 percent in 2023. For condominiums it narrowed, from 9.8 to 13.1 percent in 2018 through 2020 to 2.6 to 4.3 percent in 2021 through 2024, while May or June stayed the busiest month for condominium closings in every one of those later years. In 2020 the busiest month for house closings was October, the only year it fell outside May and June; leaving 2020 out, the house gap is 11.5 percent. Our reading: after 2020 the condominium market kept its spring rush in closings and lost most of it in price.
| Year | Houses, June against January | Condominiums, June against January | Busiest month for house closings |
|---|---|---|---|
| 2018 | +11.2% | +9.8% | June |
| 2019 | +11.1% | +13.1% | May |
| 2020 | +16.5% | +10.9% | October |
| 2021 | +10.8% | +3.4% | June |
| 2022 | +9.0% | +2.6% | May |
| 2023 | +17.9% | +3.0% | June |
| 2024 | +10.7% | +4.3% | May |
Which areas follow the calendar?
The ones with the most condominiums and the highest prices. Across the 63 community areas with at least 1,000 sales in the seven years, Hyde Park, the Loop and Lincoln Park closed about twice as many sales from April through July as from November through February. In West Englewood more closed in the winter months than in the spring ones, and in East Garfield Park, North Lawndale, Greater Grand Crossing, Gage Park and Englewood the two ran within 3.5 percent of each other. Put the 63 in order by that spring-to-winter ratio and the order follows their share of condominium sales (a rank correlation of 0.78, where 1 would mean the two orders match exactly) and their 2025 median house price (0.88, for the 61 areas with that figure on our gentrification page). It runs the other way from the share of home purchases made by companies (−0.72, and −0.61 among the 37 areas where condominiums are under a fifth of sales). The deeds add a direct measure: among houses and two-to-six-flats, purchases by people closed 37.3 percent in April through July and 27.8 percent in November through February, while purchases by companies closed 34.2 and 31.8 percent, close to even. Our reading: areas where companies buy more of the homes have flatter calendars at least in part because company purchases close at about the same pace all year; the area pattern also follows prices and condominiums, and this page cannot separate the three.
| Community area | Sales, 2018–2024 | Closed April–July | Closed November–February | Condominium share |
|---|---|---|---|---|
| Hyde Park | 1,998 | 45.4% | 21.1% | 80% |
| Loop | 4,228 | 45.9% | 21.5% | 100% |
| Lincoln Park | 9,609 | 43.9% | 21.5% | 74% |
| North Center | 4,123 | 44.0% | 22.4% | 45% |
| Lake View | 13,712 | 44.3% | 22.5% | 83% |
| Near West Side | 4,427 | 43.6% | 22.3% | 77% |
| West Town | 10,761 | 44.4% | 22.9% | 67% |
| Uptown | 5,404 | 44.4% | 23.0% | 90% |
| West Englewood | 2,629 | 32.1% | 33.1% | 0% |
| East Garfield Park | 1,116 | 33.6% | 33.3% | 18% |
| North Lawndale | 1,879 | 32.7% | 32.4% | 2% |
| Greater Grand Crossing | 2,534 | 33.7% | 33.1% | 0% |
| Gage Park | 1,079 | 31.4% | 30.8% | 1% |
| Englewood | 1,899 | 32.9% | 31.8% | 0% |
| South Lawndale | 1,448 | 33.1% | 31.9% | 1% |
| West Pullman | 2,720 | 34.0% | 32.8% | 0% |
Which day of the week do sales close?
Friday: 23.0 percent of closings, against about 18 percent on each other weekday and 3.7 percent on weekends. Closings also lean to the end of the month: 18.7 percent fell in a month’s last five days, against 16.4 percent if they were spread evenly.
What can’t the record tell you?
When an offer was made or a home was listed, how long it sat, what it was listed for, or what any single home would have brought in another month. The comparison holds the area, the year and the kind of home fixed, but not the size, the condition or the block, so part of June’s premium may be the homes themselves. Prices rose in most of these years, which lifts later months a little against a year’s median.
Where does the record live?
Every sale here is in the Cook County Assessor’s parcel sales file on the county’s data portal, and the Assessor’s address search shows one property’s recorded sales. Each community area’s median prices and sales counts are on our area pages, listed on the housing hub.
- Sales the Cook County Assessor’s parcel sales file, read September 30, 2026, with the Assessor’s own arms-length screens and single-parcel sales only, as on our recorded-prices page; condominium parking and storage parcels are left out. Houses are classes 202 to 210, 234, 278 and 295; condominiums class 299; two-to-six-flats class 211.
- Years 2018 through 2024. The file keeps adding sales for about a year and a half after they close, so 2025 and 2026 are left out of every comparison.
- Price comparison each sale’s price over the median price of its segment in its community area that year, for the area-years with 20 or more such sales; a month’s figure is the median of those ratios. The uncontrolled figure uses the citywide median for the segment and year.
- Buyers each buyer sorted by the name on the deed into a company, a trust, a bank or government body, or a person, as on our who-is-buying page; no buyer is named here.
- Areas each sale placed in a community area by its parcel’s location. The area table and the rank correlations use the 63 areas with 1,000 or more sales; house prices and company shares by area are the ones published on our gentrification page.
Computed by KCM Desk from the county’s sales file, read September 30, 2026. Nothing here is real estate advice. Human-guided and edited — about this desk. If you spot an error, corrections come first.
Related Keep Chicagoland Moving coverage
- Chicago Housing, by the Numbers
- What a Chicago Home Actually Sold For: 245,849 Deeds Since 2018, All 77 Community Areas
- Who Is Buying Chicago? The Buyer’s Name on 245,849 Deeds: Companies Bought 13 Percent of Homes and 46 Percent of Those Resold Within Two Years
- Chicago Houses and Two-to-Six-Flats Sold in 2025 Were Valued at 81 Percent of Their Sale Prices. Those Resold Within Two Years, at 60 Percent.
- Where Chicago’s Gentrification Signals Are Active: East Garfield Park, New City and North Lawndale Show Four of Five. Logan Square, Avondale and the Lower West Side Show None.
- Chicago’s Tax Rolls Show 7,875 Fewer Two-to-Six-Flats Than in 2006. Of the 13,049 Parcels That Left the Count, 6,208 Are Now Classed as Single-Family Houses.